
BTC Remains Steady Around $74K While Equities Climb Amid Rising Treasury Yields
The cryptocurrency maintained a tight trading corridor while technology equities attracted dip buyers and Treasury yields surged following elevated CPI inflation figures.
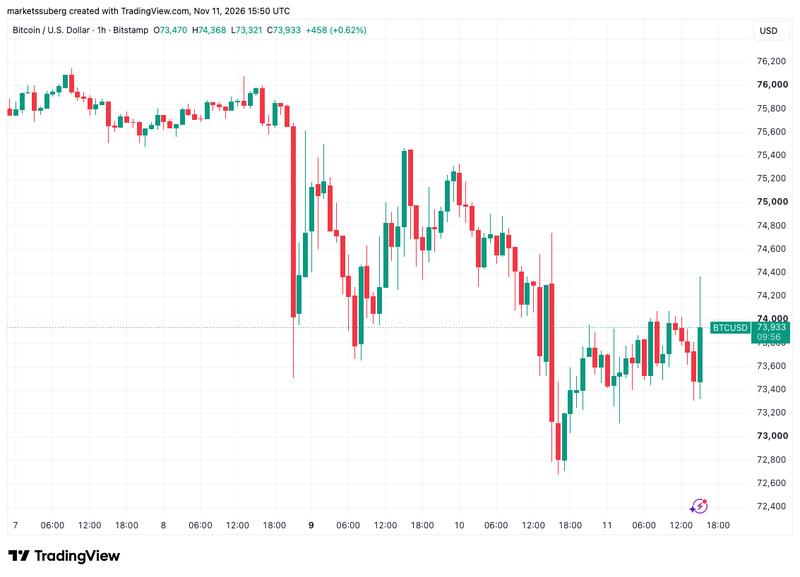
As Wall Street commenced trading on Wednesday, Bitcoin (BTC) maintained its position around the $74,000 level while equity markets experienced gains and yields on US government bonds climbed higher.
Key points:
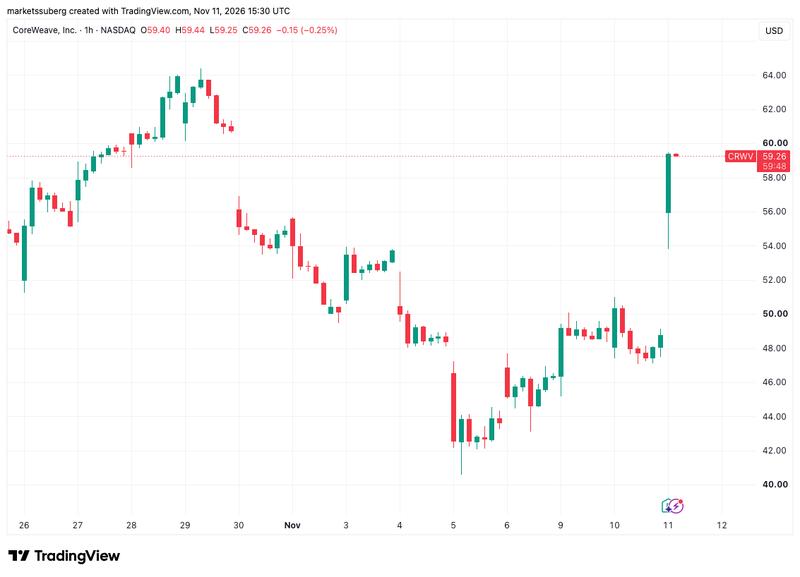
- Bitcoin decoupled from US equity performance even as CoreWeave surged by as much as 21% following stronger-than-anticipated Q3 revenue results.
- The yield on the US 10-year Treasury note reached a peak of 5.02% following the release of US CPI inflation data that exceeded forecasts.
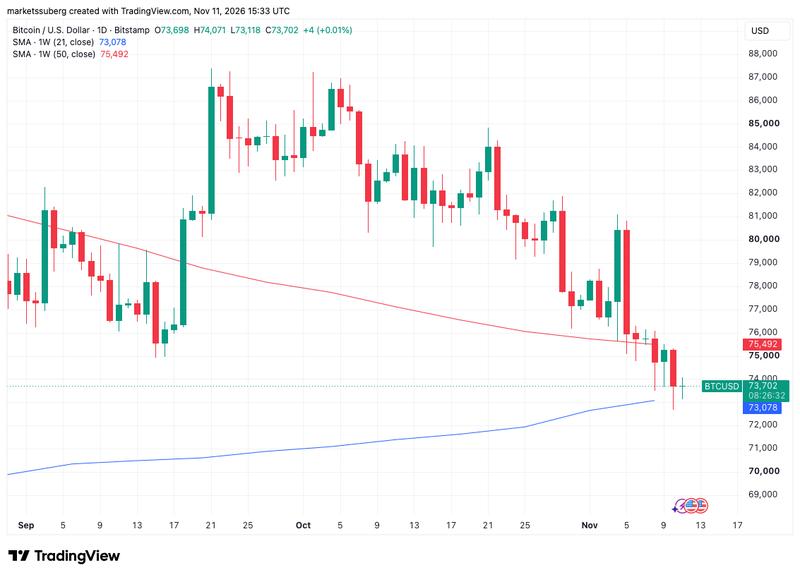
- BTC maintained its position within a confined range bounded by its 21-week and 50-week trend lines positioned at $73,078 and $75,492, respectively.
Technology equities advance as 10-year Treasury yield climbs back to 5%
According to data provided by TradingView, the BTC/USD trading pair demonstrated a decoupling pattern from US stock indices as market participants continued their strategy of purchasing technology stocks during price declines.
Artificial intelligence-focused companies spearheaded the early trading session gains, with cloud-computing provider CoreWeave experiencing a surge exceeding 20% following the announcement of Q3 revenue figures that surpassed analyst expectations and an upward revision of its 2026 financial outlook.
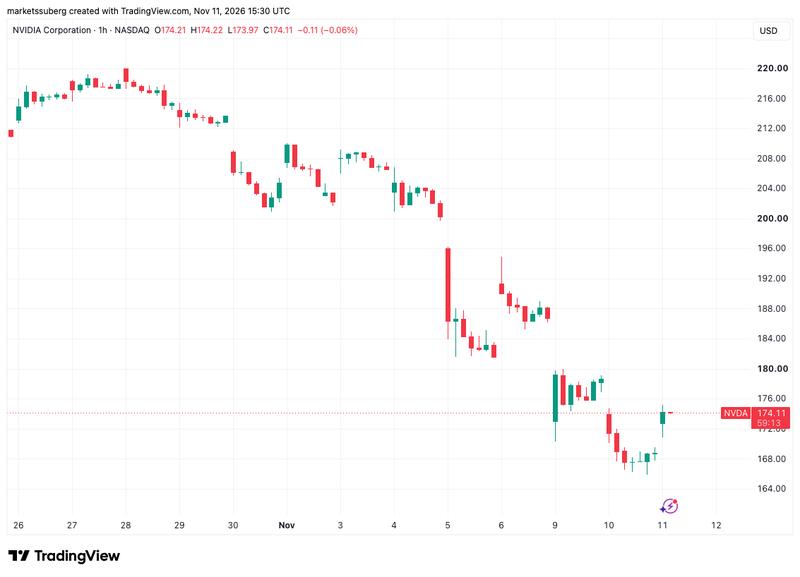
Meanwhile, Nvidia shares, which experienced declines during Monday and Tuesday's sessions due to persistent controversy surrounding CEO Jensen Huang, commenced Wednesday's trading session approximately 2.5% above the previous close.
Crude oil markets experienced upward price movement during the session as confidence in achieving a diplomatic resolution to the US-Iran military conflict continued to diminish. With attacks persisting on vessels navigating through the Strait of Hormuz, industry analysts highlighted multiple logistical challenges that would need to be addressed before shipping traffic could return to levels seen before the conflict, even in the scenario of a negotiated settlement.
Even in the event a deal is struck, an increase in flows through the waterway would still depend on mine clearance, insurance costs and whether or not shipowners would even be willing to take the risk.
LSEG Oil Research, according to Reuters
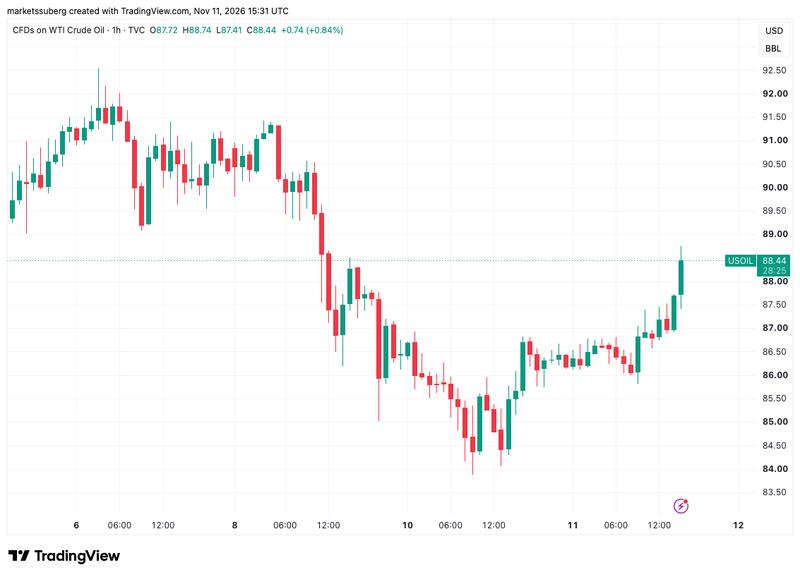
West Texas Intermediate crude oil from the United States posted a 1.4% daily increase to reach $87.70 per barrel after declining to $84 during Tuesday's session, marking its weakest level since the closing days of August. Brent crude experienced a 1.5% advance to $93.40.
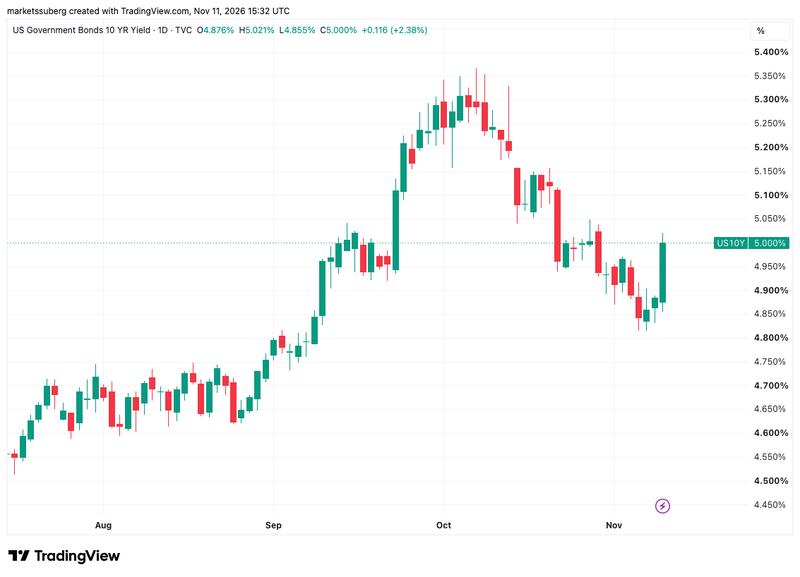
Equity markets posted gains despite the fact that Tuesday's Consumer Price Index (CPI) inflation report, which came in above market forecasts, drove US government bond yields significantly higher. Wednesday saw the 10-year Treasury yield climb back to the 5% threshold for the first time since Oct. 29, while the 30-year yield touched a high of 5.378%, matching levels last observed on Oct. 22.
According to Peter Boockvar, chief investment officer at One Point BFG Wealth Partners, the bond market was incorporating expectations of a more aggressive stance on interest rate policy from the US Federal Reserve. Current market pricing reflects a 0.25% rate hike in December as the base case scenario, with probability increasing for a 0.5% increase.
Inflation breakevens today are focused on the drop in oil prices while regular Treasuries today are reacting to a Fed that is definitely going to hike next month, as of now, with one another in January.
Peter Boockvar, told CNBC
Bitcoin price maintains position within two critical trend lines
The flagship cryptocurrency continued its confined trading pattern, remaining positioned between its 21-week and 50-week simple moving average levels of $73,078 and $75,492, respectively. Market volatility subsided as trading participants waited for fresh market-moving developments following the release of the CPI inflation report.
Market participant profitability experienced deterioration as Bitcoin relinquished support in the vicinity of $75,700, representing the collective cost basis for the short-term holder (STH) cohort - market participants who have held their BTC holdings without executing sales for periods of up to 155 days.
During Tuesday's trading session, wallets categorized as STH transferred more than 47,000 BTC to cryptocurrency exchanges while holding unrealized losses on those positions, a movement that could indicate an escalation in capitulation selling behavior if those tokens were subsequently liquidated.