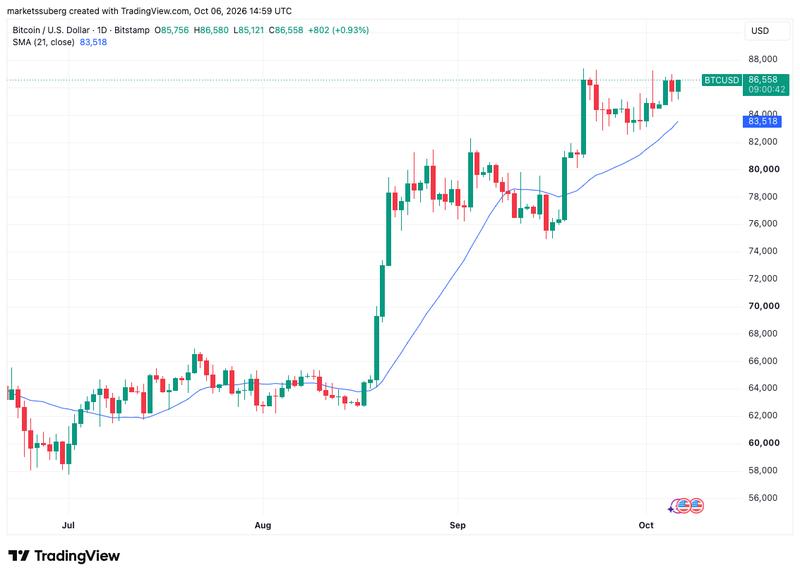
BTC Pushes Closer to $87K While US Stock Markets Reach Fresh Record Peaks
As the S&P 500 and Nasdaq surged to unprecedented all-time highs, Bitcoin struggled to break through resistance near the $87,000 level where ask liquidity remains concentrated.

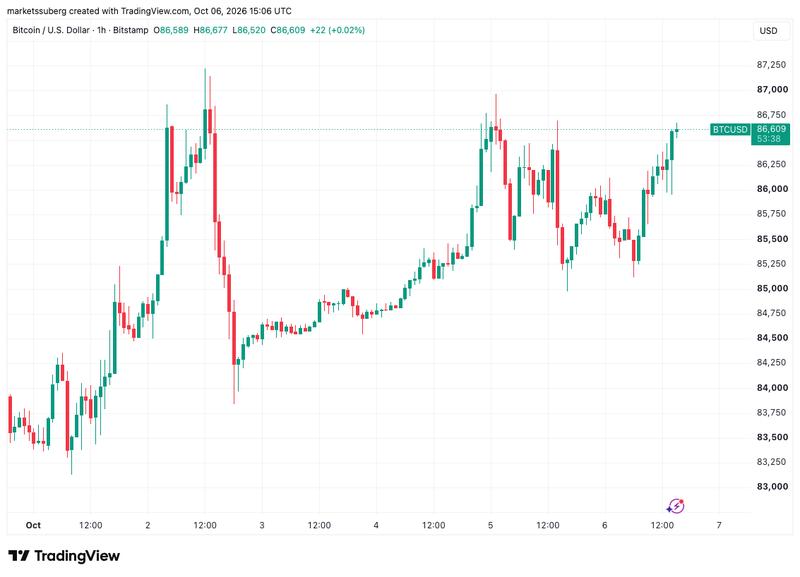
On Tuesday, Bitcoin (BTC) persisted in hovering around the $86,000 mark while United States equity markets achieved new all-time record levels.
Key points:
- Bitcoin made efforts to push toward the $87,000 threshold but encountered persistent resistance from concentrated ask liquidity positioned around this critical price point.
- Equity markets in the United States climbed back to record territory, with the S&P 500 Index gaining 0.8% to settle at 7,835 points.
- Technical analysis of BTC pricing identified the 21-day simple moving average (SMA) positioned at $83,500 as the nearest critical support zone.
Bitcoin trades sideways while S&P 500, Nasdaq achieve fresh records
According to data sourced from TradingView, BTC/USD made another push back toward the $87,000 mark following yet another unsuccessful breakout attempt that occurred on Monday.
Following the opening bell on Wall Street, equities captured significant attention as the S&P 500, Nasdaq 100 and the technology-focused Nasdaq Composite Index all reached unprecedented record peaks of 7,835, 31,312 and 27,683 points, respectively.
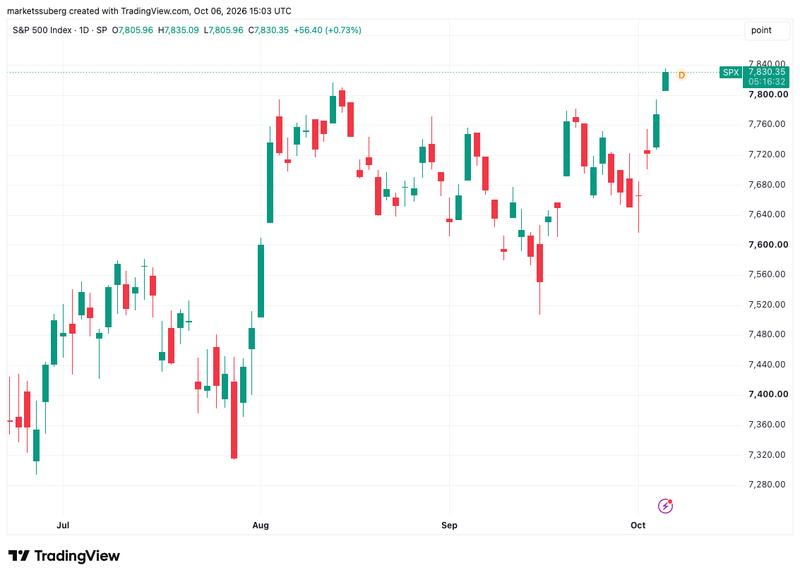
Providing commentary on this market movement, trading analysis resource The Kobeissi Letter observed that the S&P 500 has experienced a 24% increase, adding $71.3 trillion in total value since March 30.
In fresh analysis examining the future trajectory for equity markets, Mosaic Asset Company put forward the view that diminishing expectations regarding interest-rate increases from the Federal Reserve during Q4 2026 might drive markets to even greater heights.
"Shifting views around the Fed and a slower pace of rate hikes could become the catalyst for a durable rally," the firm summarized on Tuesday.
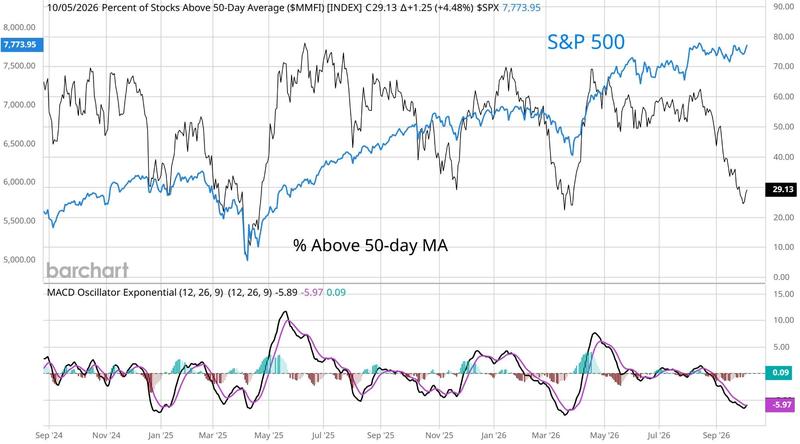
Mosaic emphasized that market breadth for stocks remained close to its weakest point in six months, noting that only 25% of individual stocks were trading above their 50-day simple moving average (SMA) during the previous week. Technology sector companies contributed the majority of the recent gains.
"Breadth has been this oversold just one other time this year, which was back in late March as the S&P 500 fell near correction territory. Oversold conditions helped spark a reversal back then, and could do so again," it commented.
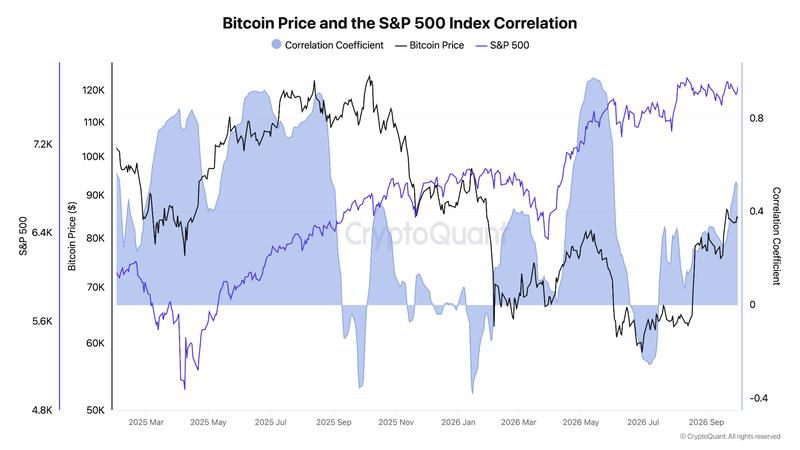
Information from onchain analytics platform CryptoQuant reveals a moderate positive correlation currently exists between Bitcoin and the S&P 500. The correlation coefficient stands at 0.51 as of Oct. 2, representing its most elevated reading since the beginning of June.
Bitcoin price support depends on 21-day moving average trend line
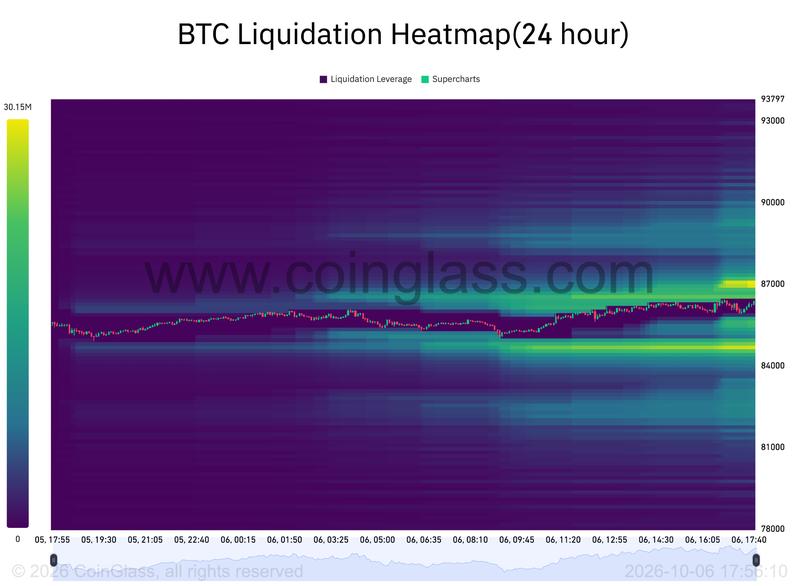
The price action for BTC remained under persistent overhead resistance in the vicinity of range highs, attributable to ask liquidity concentrated on exchange order books.
Information provided by CoinGlass revealed on Tuesday that the most significant concentration of liquidity was positioned near the $87,000 level. A "ladder" pattern of ask orders stretched downward to $86,500, likely playing a role in limiting upward price momentum.
In his most recent market overview posted on X, Keith Alan, cofounder of crypto trading suite Material Indicators, pinpointed support at the $83,500 level, which represents Bitcoin's present 21-day SMA. This price level was most recently traded on Sept. 18.
"I'm watching price around $83,555, the structure of any $82,500 support test, and whether buyers can clear the Monthly signal's $87,375 invalidation threshold," Alan wrote in analysis on Oct. 1.
"Beyond that, a reclaim and successful retest of the Yearly Open at $87,496 would strengthen my case for a durable move above $91,540 which would act as another validation of a confirmed bull market."