BTC Price Action Mirrors 2022 Bear Market 'Almost Perfectly' as Critical Support Level Threatens to Break
Market analysts issue alerts about Bitcoin's crucial support trend line potentially breaking down while 2022's bearish market patterns appear to be repeating themselves.
On Wednesday, Bitcoin (BTC) remained positioned close to its lowest price levels in two months as analysts drew parallels to the 2022 bear-market scenario.
Key points:
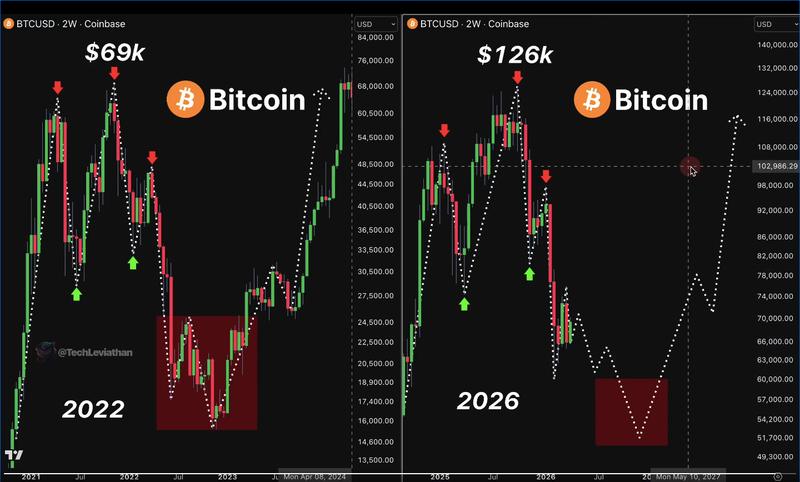
- Market analysts are revisiting the 2022 bearish cycle to evaluate potential future movements in BTC price behavior.
- Historical patterns reveal the formation of a fresh lower high preceding the collapse of a critical 50-month trend line.
- Throughout 2026 up until now, this trend line has maintained its position.
Analysis: Bitcoin 50-month trend line break down "likely"
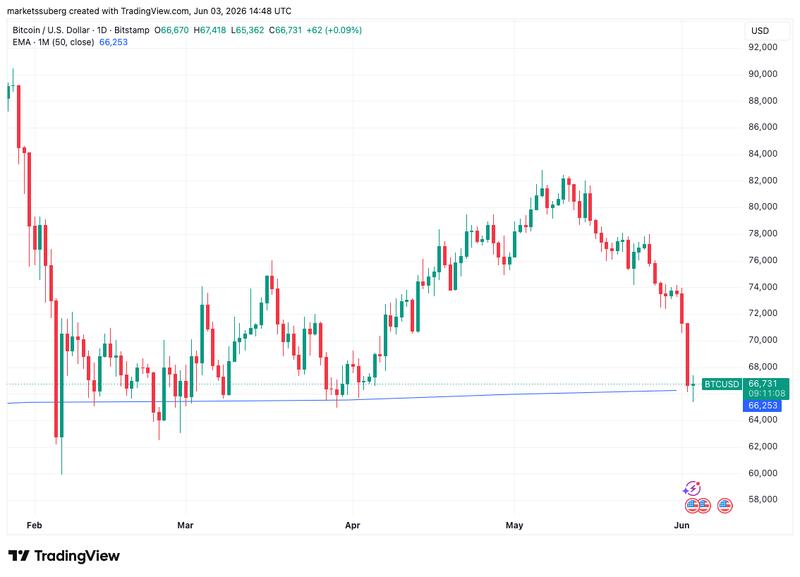
Information sourced from TradingView revealed diminishing BTC price fluctuations following a descent to $65,362 on the Bitstamp exchange — marking a price point not witnessed since the beginning of April.
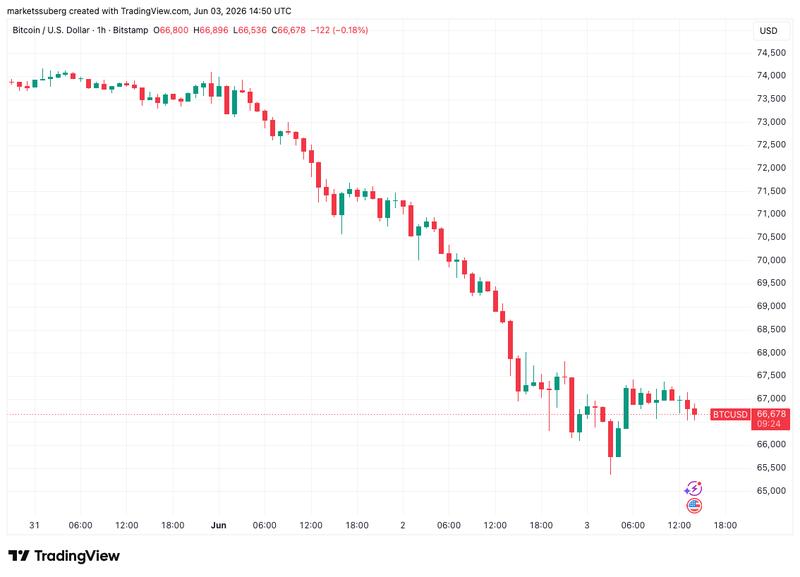
Following liquidations worth billions of dollars, BTC/USD received fresh cautionary signals suggesting that the bear market's most severe phase could still lie ahead.
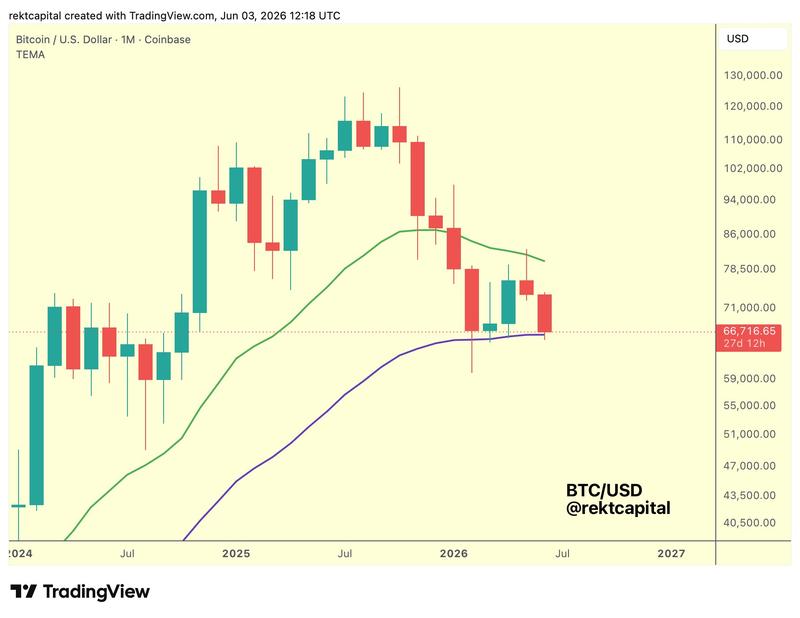
Market analyst and trader Rekt Capital concentrated attention on the 50-month exponential moving average (EMA) trend line positioned at $66,628.
"As time progresses, Bitcoin is expected to break down from this EMA level and persist with macro-level downward movement in this Bear Market," he cautioned in a series of posts shared on X.
According to Rekt Capital's analysis, should historical patterns from the 2022 bear market cycle repeat themselves, the price would be expected to experience a temporary relief rally creating a lower high before descending back toward the 50-month EMA, which would subsequently lose its function as a support level.
"Historical data shows that Bitcoin typically experiences an initial bounce from the 50-Month EMA but subsequently loses this level as supportive ground as the Bear Cycle advances," he elaborated.
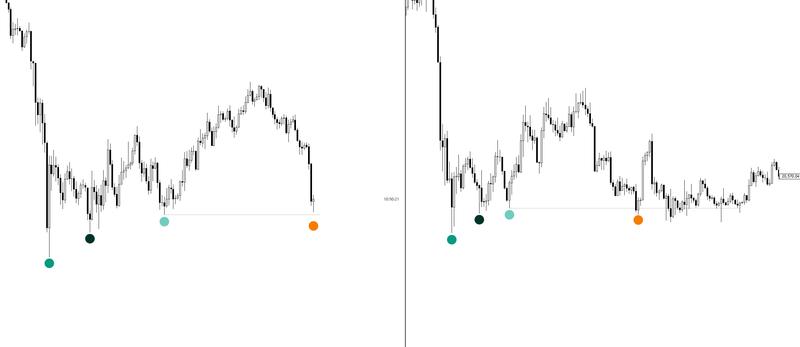
In a continuation of this analysis, market trader Leviathan contended that the 2026 bear market trajectory was replicating its 2022 counterpart "almost perfectly."
"Each phase materializing in identical sequence," stated an X post, identifying $60,000 as the "line that matters."
"Hold it - liquidity flush complete, recovery begins. Lose it - deeper correction, no support below. One level, two completely different outcomes. Market makes the call soon."
Yet another market participant, trader Killa, utilized 2022 price behavior patterns to forecast "weeks" of sideways consolidation activity ranging between $63,000 and $65,000 in the upcoming period.
BTC price support reclaim could offer 700%+ returns
However, a potentially positive outlook for the day emerged from examining historical responses to the 50-month EMA level.
Market analytics account Paradox highlighted the magnitude of prospective gains that might materialize from Bitcoin's future recapture of the trend line following its loss.
"$BTC lost the monthly 50MA in 2022. It reclaimed it 5 months later, delivering a 715% return over the next 2 years," the account shared with its X followers.
During February, BTC/USD registered multiple daily closing prices beneath the trend line but successfully prevented a complete breakdown. During the March and April timeframes, conversely, the trend line operated effectively in its capacity as a support mechanism.