BTC power-law analysis suggests $58K decline remains within historical norms despite potential for further losses
The recent Bitcoin decline to $58,000 aligns with historical cycle lows according to power-law analysis, though derivatives data suggests BTC could experience additional downside pressure.

The recent decline in Bitcoin's (BTC) price to $58,000 has brought the cryptocurrency into a territory that historically corresponds with cycle bottoms according to long-term power-law modeling. While this data doesn't definitively establish a bottom formation, it demonstrates that BTC is currently trading within a price zone that has consistently signaled significant lows throughout its history dating back to 2014.
Analysis of derivatives markets and liquidation clustering points to $55,000 as the subsequent critical support zone, while identifying the $65,000-$68,000 territory as the next significant resistance area worth monitoring.
Power-law model frames $58,000 within historical parameters
The Bitcoin power-law framework developed by Giovanni indicates the network's extended trend valuation sits around $135,000, positioning the current retreat to $58,000 at approximately 54% beneath the peak and 1.22 standard deviations under that established trend line.
The analyst emphasizes that the central insight is clear: historical cycle bottoms observed in 2012, 2015, 2019, 2020, and 2022 each occurred within comparable statistical parameters. Measured against this framework, the current pullback occupies a zone that has traditionally characterized profound bear-market troughs rather than signaling a breakdown of Bitcoin's extended upward trajectory.
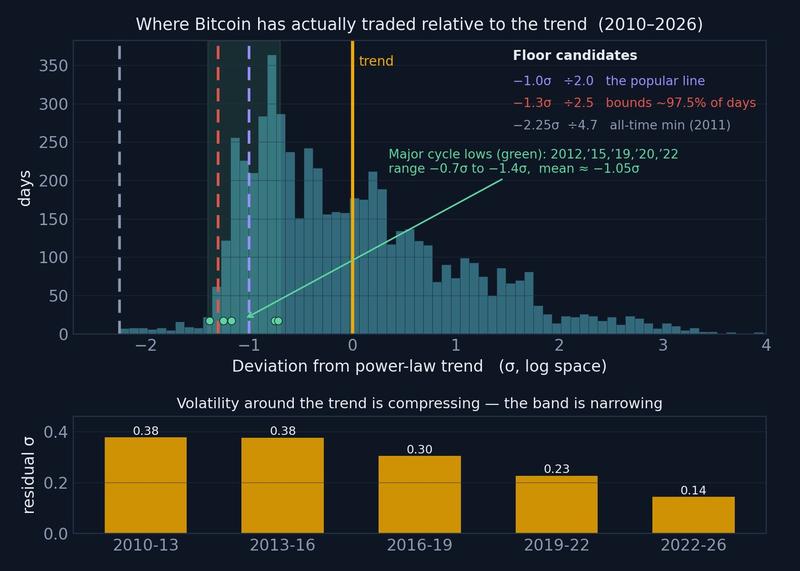
The analytical framework positions the frequently cited "-1σ" support level around $68,000, with the more robust historical support floor positioned nearer to $55,000. Giovanni further observed that Bitcoin would require sustained trading beneath approximately $17,000 for an extended period exceeding one year before the underlying power-law framework itself could be deemed broken.
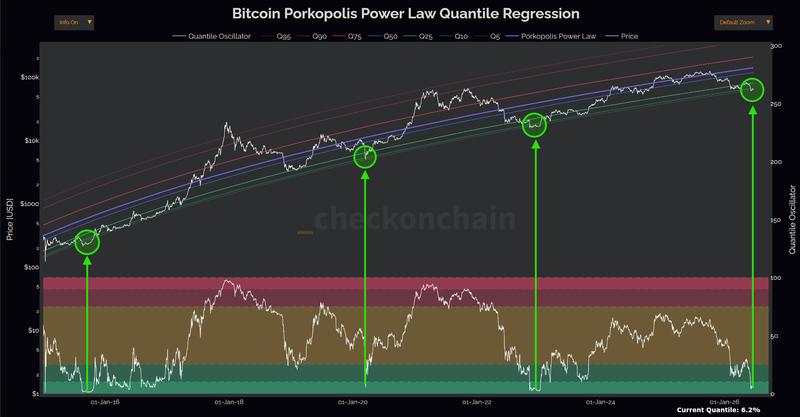
An additional analytical measure reinforces this interpretation. The power-law quantile for Bitcoin has descended to 6.2%, suggesting the digital asset is currently priced lower than approximately 94% of all historical price points when evaluated through the power-law framework. Historical chart analysis reveals comparable readings throughout the 2015, 2020, and 2023 cyclical bottoms, with present market conditions now returning to this statistically uncommon valuation territory.
Critical BTC price zones under observation
Bitcoin established a fresh yearly bottom at $58,000 following intense selling activity concentrated on Binance. Hourly taker sell volume surged to $2.1 billion, with an additional $1.9 billion materializing in the subsequent hour following the New York trading session opening, representing the platform's most substantial hourly selling pressure registered since May 4.
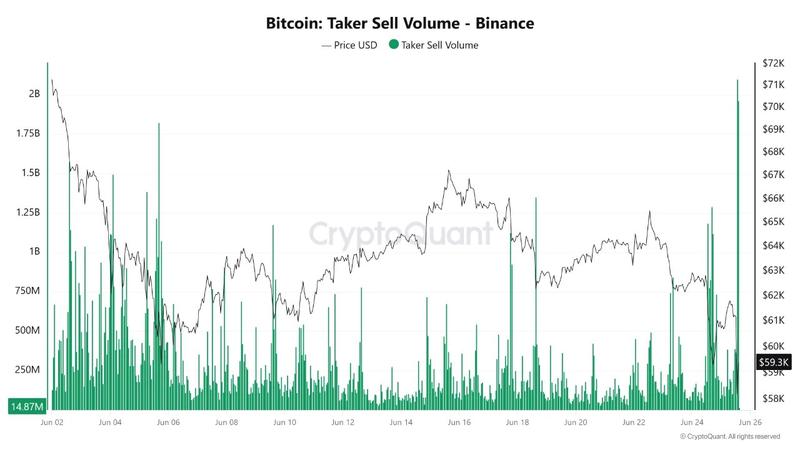
The dramatic selloff eliminated over $300 million worth of long BTC positions before prices recovered movement toward $60,000. This price point now assumes heightened importance. A daily candle closure above $60,000 would maintain the emerging relative-strength index (RSI) bullish divergence pattern observable across one-hour, four-hour, and daily timeframes, indicating diminishing selling pressure despite the formation of successive lower price lows.
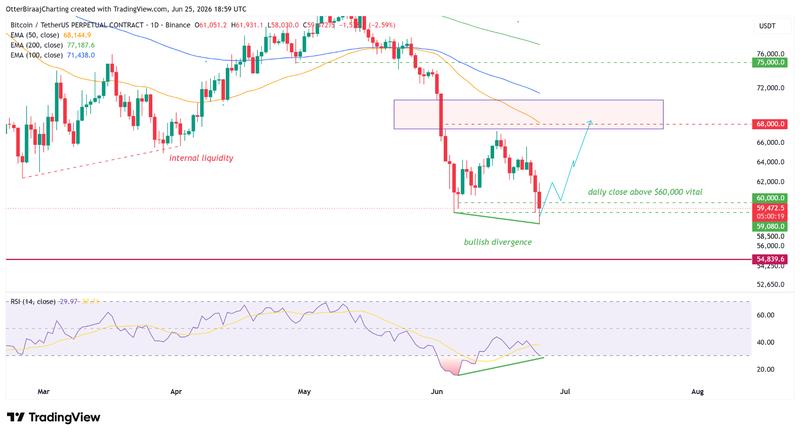
Derivatives market analyst Byzantine General expressed a comparable perspective, noting the descent to $58,000 eliminated overleveraged long positions while simultaneously attracting new short-side participants. His analysis suggests that achieving a daily close above $60,000 would reinforce the possibility that Bitcoin has established a near-term bottom.
Such a development would redirect market focus toward a substantial concentration of upside liquidity. Approximately $4 billion in short position liquidations accumulate near $65,000, contrasted with roughly $1 billion positioned below $55,000, establishing a four-to-one asymmetry. Any corrective rally could subsequently aim for internal liquidity concentrations near $68,000, where a daily fair-value gap provides an additional zone of significance for market participants.
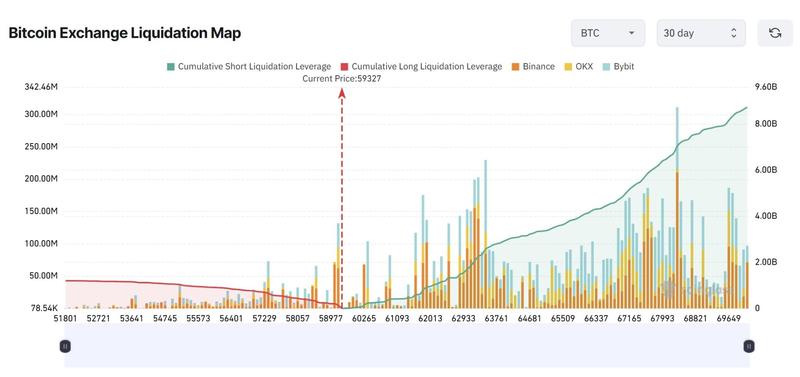
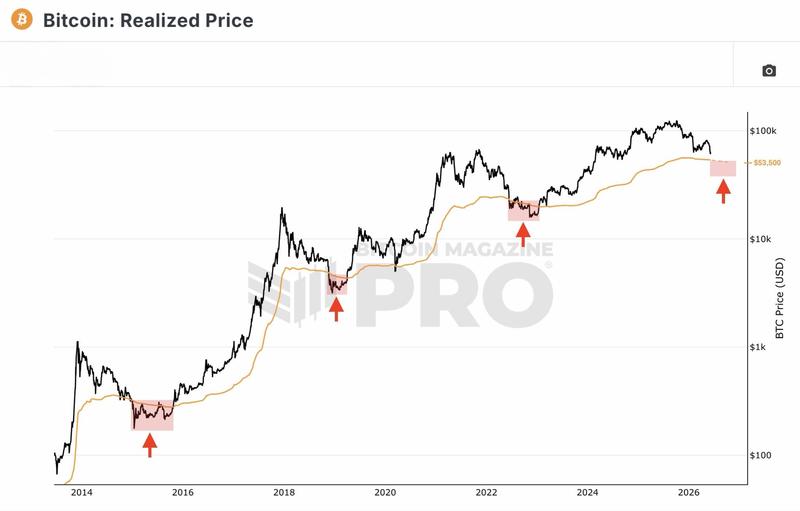
Conversely, a daily close beneath $60,000 would validate bearish sentiment across both near-term and extended timeframe charts. The subsequent zone of focus would transition to $55,000, where Bitcoin's September 2024 weekly range minimum intersects with its realized price positioned near $54,000.
The realized price metric, which calculates the average acquisition cost of all on-chain coins, has historically functioned as support during every significant Bitcoin bear-market trough since 2014. This historical pattern establishes the $54,000-$55,000 range as a critical zone warranting close attention from traders should downward pressure persist.