
BTC plunges toward $58K as bearish signals mount: Could sub-$50K be next?
The fall of Bitcoin to $58,000 has validated a bear flag pattern breakdown, establishing a fresh price objective at $54,000 or potentially lower levels.

On Thursday, Bitcoin (BTC) slipped beneath the critical $60,000 psychological threshold as declining megacap technology equities dampened investors' appetite for broader risk assets, compounding stress on an already vulnerable cryptocurrency market.
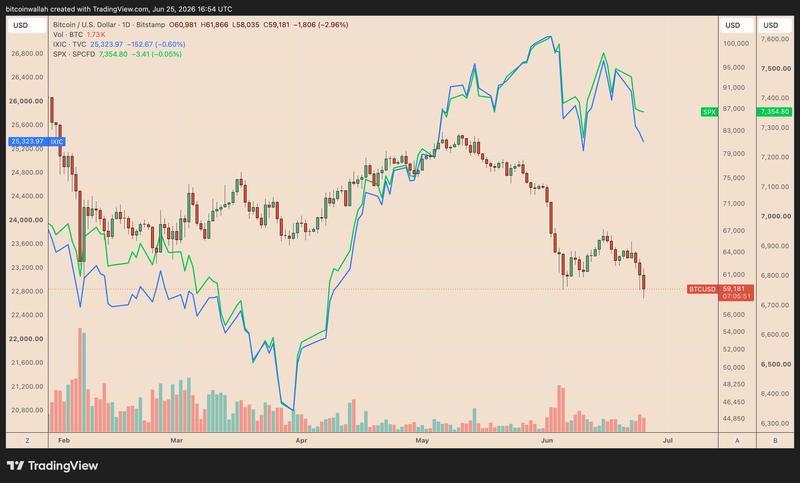
This downturn has activated a textbook bearish reversal formation that could potentially drive the BTC price beneath the $54,000 threshold over the next several days.
Key takeaways:
- Bitcoin's breakdown beneath $60,000 has wiped out its June rallies and triggered several bearish technical patterns.
- Both Bitcoin's rounded top formation and daily bear flag breakdowns are pointing toward a downside objective below $54,000.
Rounded top breakdown for BTC indicates further downside
On Thursday, the BTC/USD pair tumbled by as much as 4.8%, reaching an intraday bottom near $58,000 and completely erasing all gains accumulated throughout June. This pullback has also finalized what technical analysts identify as a rounded top configuration on the four-hour timeframe chart.
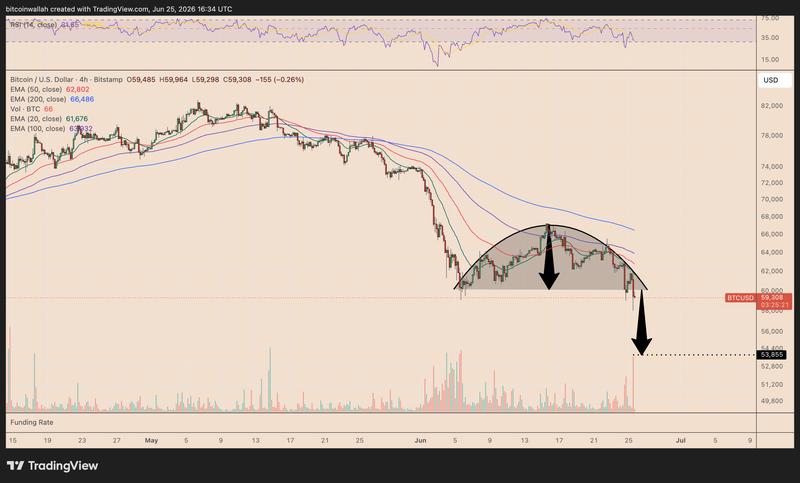
Within technical analysis frameworks, a rounded top emerges when purchasing momentum progressively weakens, transitioning the asset from an upward trajectory to a downward trajectory through an inverted-U-shaped formation. This pattern becomes officially confirmed once the price penetrates below the "neckline" or the foundational support level of the structure.
Through measuring the vertical distance from the dome's peak to the neckline and extending that identical distance downward from the point of breakdown, technical analysts derive a precise price objective.
For Bitcoin, this measured downside objective rests just beneath the $54,000 threshold, which represents approximately an 8.9% decline from present price levels.
Examining the daily chart reveals that Bitcoin has concurrently activated a bear flag breakdown pattern.
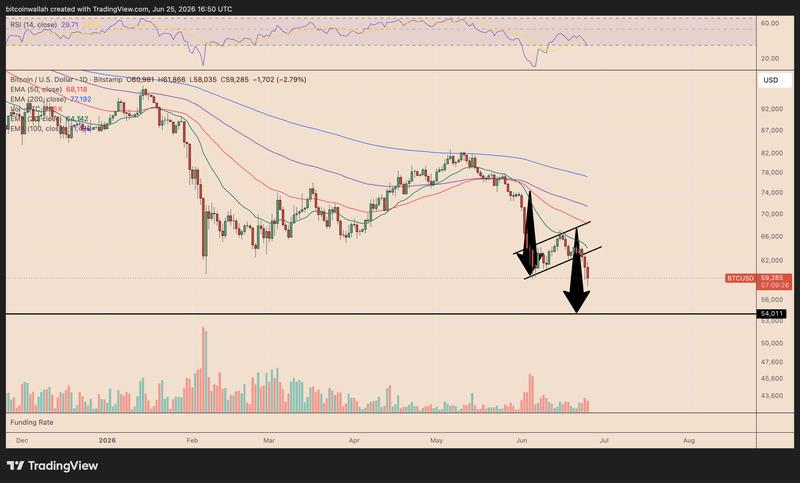
This additional pattern independently forecasts an identical movement toward the $54,000 region, providing considerable reinforcement to the bearish outlook.
MVRV bands for Bitcoin strengthen $54,000 target probability
On-chain price bands for Bitcoin also indicate the same downside region identified by both the rounded-top and bear-flag formations.
The MVRV pricing bands from Glassnode establish a comparison between Bitcoin's market price and its realized price, which represents the average price at which coins most recently transferred on-chain. Put simply, these bands indicate whether the market is currently trading at abnormally elevated profit or loss thresholds.
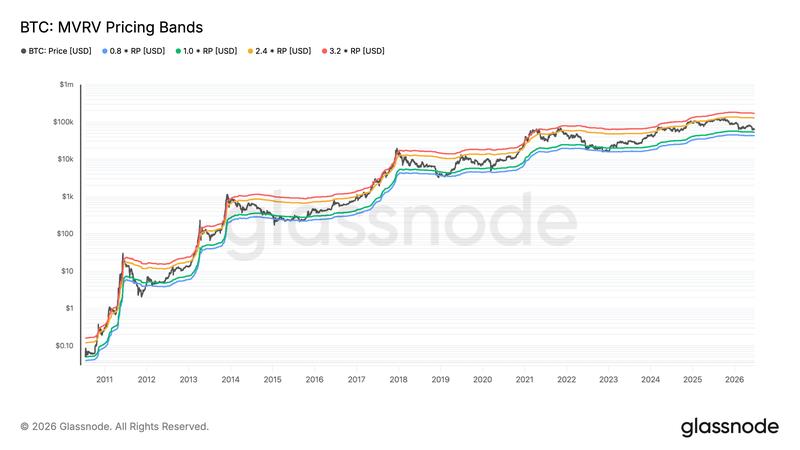
According to Wednesday's data, Bitcoin was changing hands near $60,997, whereas the 1.0 MVRV band, displayed in green, positioned itself around $53,390. This level corresponds closely with the technical downside objective near $54,000, establishing it as a crucial support area should BTC continue its decline.
A more pronounced selloff, nevertheless, might drive Bitcoin toward the 0.8 MVRV band, illustrated in blue, near $42,700. Throughout history, Bitcoin's significant bear-market troughs have developed around this lower blue band threshold, where unrealized losses reach extreme levels, and the probability of capitulation intensifies.