BTC Plunges to $58K Amid Surging PCE Inflation While Traders Cry 'Manipulation'
The leading cryptocurrency sank to its lowest point in 21 months amid elevated stock market turbulence and US PCE inflation reaching three-year peaks, triggering $600 million in crypto liquidations within one hour.
Bitcoin (BTC) plunged to fresh 21-month lows during Thursday's Wall Street opening session as elevated US inflation data created turbulence across stock markets.
Key points:
- Bitcoin retreats to its weakest position since September 2024, plummeting to $58,000.
- US PCE inflation triggers equity market chaos, with the Nasdaq 100 losing 2% within a mere 30-minute window.
- BTC's downward movement echoes the price behavior witnessed during the 2022 bear market cycle.
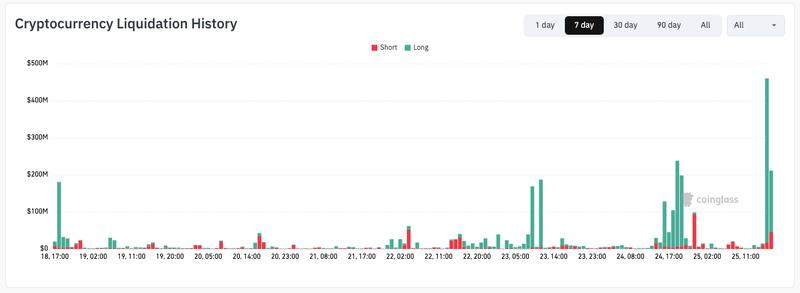
Cryptocurrency liquidations exceed $600 million within a single hour as BTC price tumbles
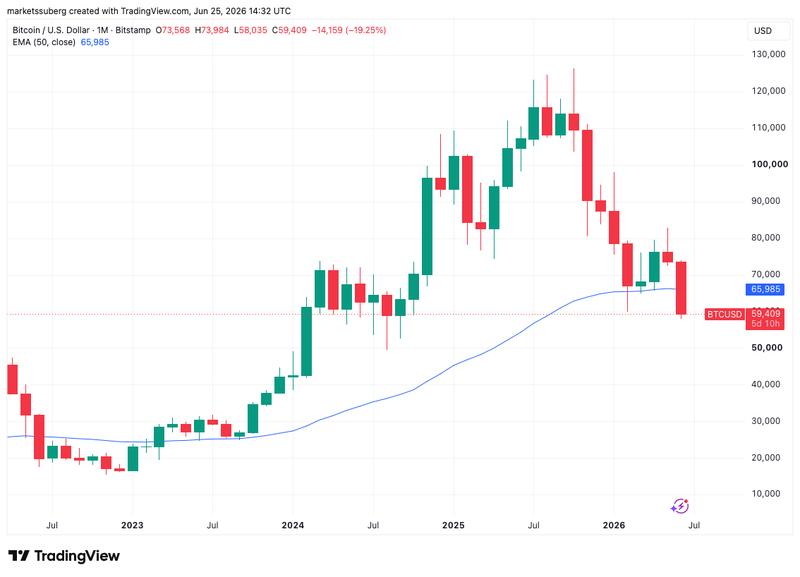
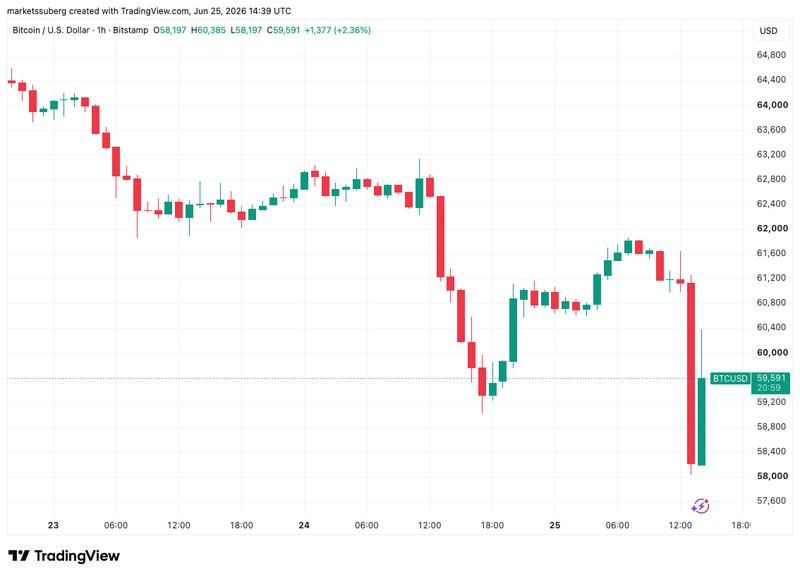
Information from TradingView revealed BTC/USD tumbling to $58,035 on the Bitstamp exchange — a price level not witnessed since September 2024.
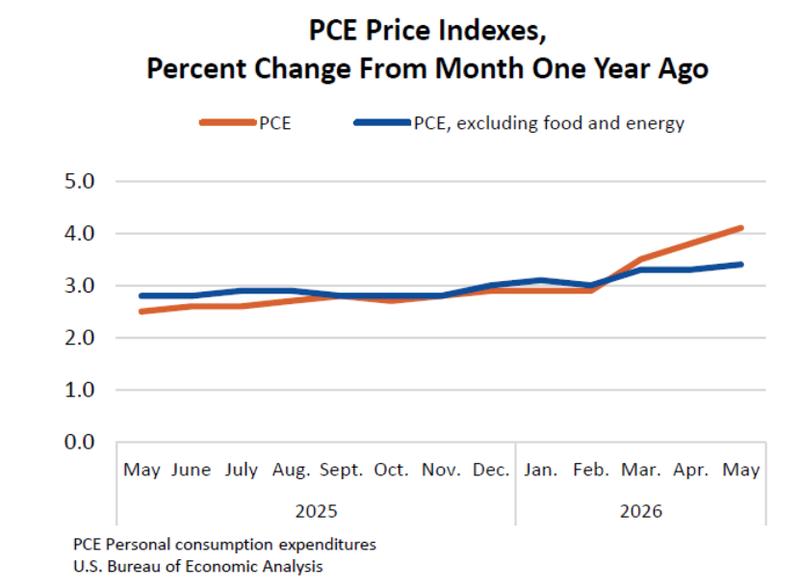
The May reading of the US Personal Consumption Expenditures (PCE) index registered at 4.1%, establishing a fresh three-year high.
"From the preceding month, the PCE price index for May increased 0.4 percent. Excluding food and energy, the PCE price index increased 0.3 percent," a data release from the Bureau of Economic Analysis (BEA) stated.
"From the same month one year ago, the PCE price index for May increased 4.1 percent. Excluding food and energy, the PCE price index increased 3.4 percent from one year ago."
Equities responded with significant volatility, with the Nasdaq Composite Index trading down 0.5% at the time of writing, while the S&P 500 successfully posted a modest gain.
The Nasdaq 100, on the other hand, experienced a more dramatic rapid decline of 2% within just 30 minutes following the market open.
"What a chart," trading resource The Kobeissi Letter responded on X.
Bitcoin's decline triggered substantial long position liquidations, with CoinGlass reporting the aggregate crypto liquidation figure at $600 million across a single hour.
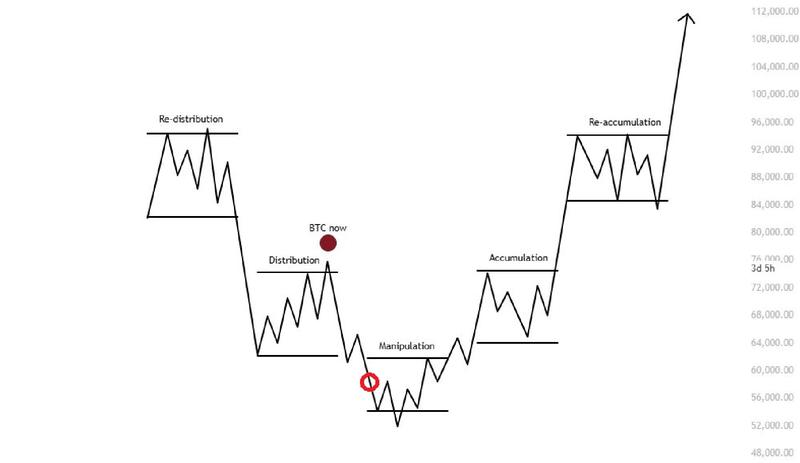
Offering commentary, market participants put forward theories that price movements were being synthetically controlled to liquidate positions.
"$BTC is in the manipulation phase," pseudonymous trader Killa told X followers.
"Every time $BTC trades sub-$60K, that is our manipulation beneath the significant $60K swing low on the weekly and quarterly. Precisely the reason why the orderbook is stacked below us."
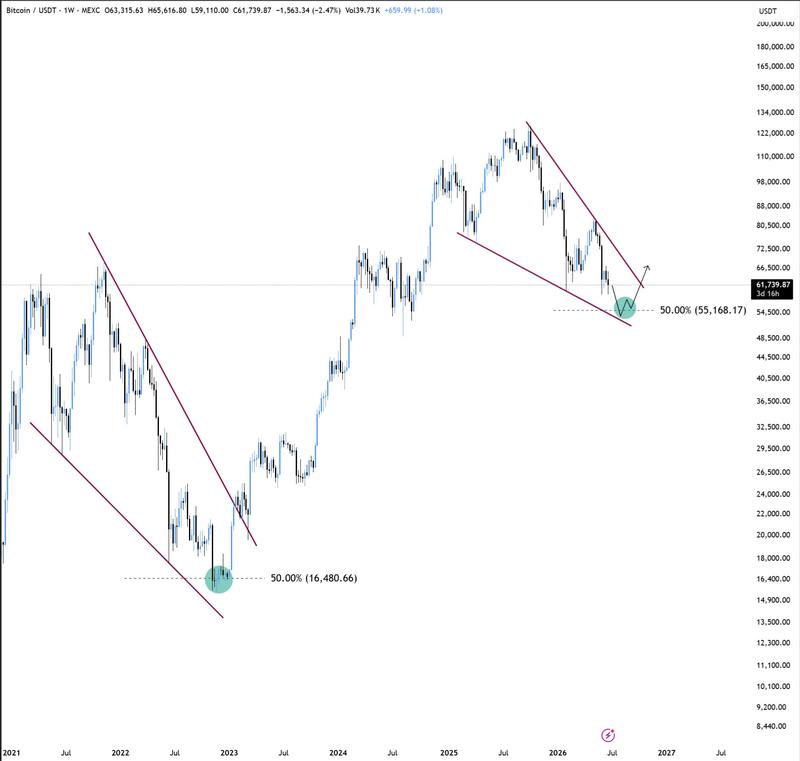
Niels Klaver, cofounder of crypto platform STABL Agency, proposed that BTC/USD "seems to be going for its final leg down of this bear market."
"$55K remains the target," he added, referring to an increasingly popular short-term price goal.
Bitcoin technical analysis identifies new resistance zone near $65,000
While BTC price action made attempts at a modest rebound, trader and analyst Rekt Capital had previously characterized $60,000 support as "clearly weakening."
"Once June Monthly Closes, we'll know from which price July will be able to potentially spring into a post-breakdown relief rally," an X post read.
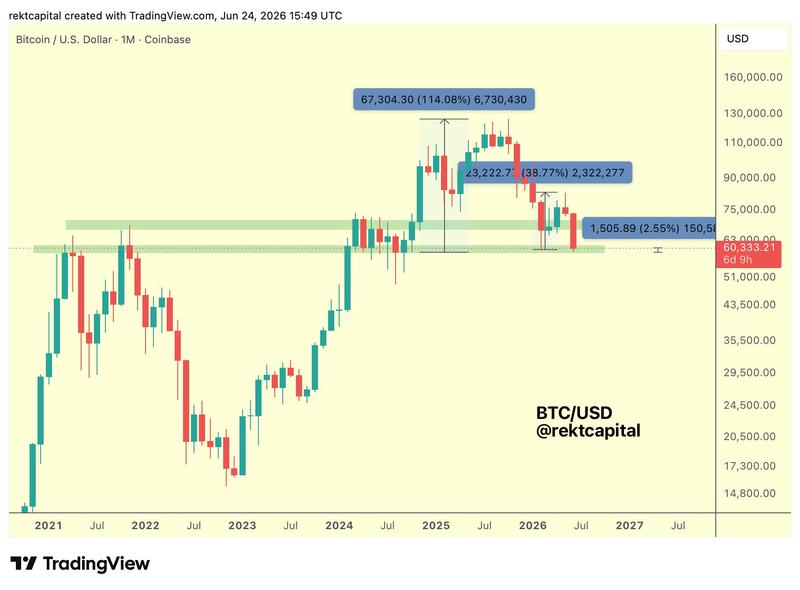
Rekt Capital emphasized that the market was displaying behavior similar to 2022, with the 50-month exponential moving average (EMA) expected to transform into new resistance ahead.