BTC faces cooling period beneath $75K threshold amid growing 'active distribution' indicators
As Bitcoin descended toward the $73,000 mark, active distribution indicators emerged, though diminished realized losses and subdued spot trading volumes suggest declining selling momentum.

Wednesday's decline that pushed Bitcoin beneath the $73,000 threshold represents a near-term inflection point for market participants, with several BTC distribution indicators suggesting an uptick in sell-side momentum.
Although the probability of a price correction into the $60,000-$70,000 territory continues to exist, data from long-term holder wallets indicates strengthening investor confidence, hinting that market participants perceive current pricing levels as attractive entry points.
Coinbase premium discount reveals market tension
According to crypto analyst CryptoOnChain, the descent of Bitcoin to $72,500 came after a stretch of diminishing spot market demand coupled with excessive long positioning within derivatives platforms. The Coinbase premium index registered a -1,083% variance from its quarterly moving average, marking one of the most substantial discounts on record throughout 2025.
This premium differential reached -$94.95, demonstrating that traders operating from the United States offloaded Bitcoin at valuations beneath those found in international exchange markets. Historical data shows that readings of comparable magnitude have typically emerged during significant distribution cycles rather than routine price retracements.
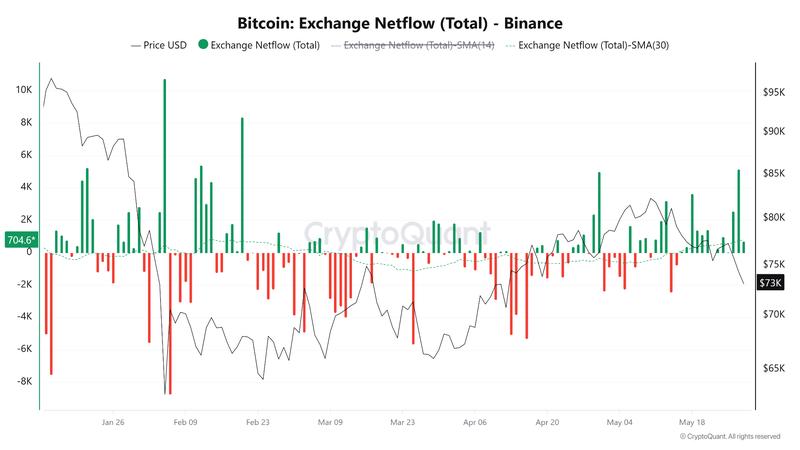
The intensity of selling activity simultaneously migrated toward Binance. The exchange experienced Bitcoin netflows averaging +1,496 BTC throughout the most recent seven-day window, representing a 528% surge relative to the quarterly average.
Futures market data for BTC contributed additional downward momentum. Funding rates on Binance surged 781% beyond their three-month baseline prior to Bitcoin's break below the $75,000 threshold. Wednesday also witnessed crypto liquidations totaling $935 million, coinciding with a $41 billion contraction in the aggregate cryptocurrency market capitalization.
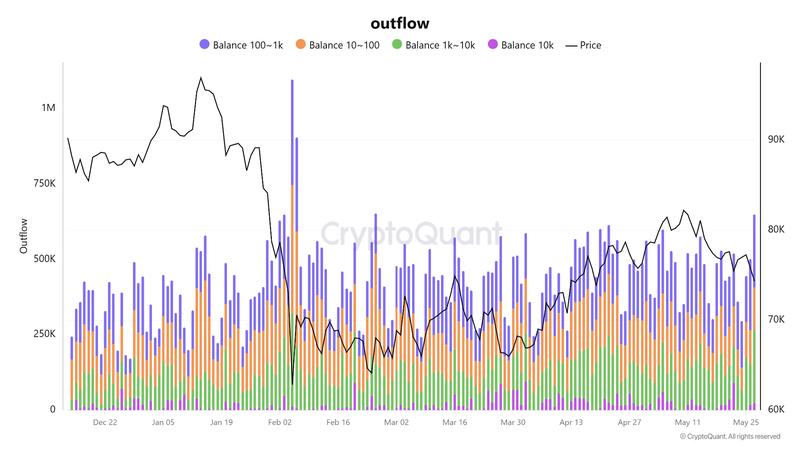
Blockchain-level activity spanning different BTC wallet categories revealed substantial capital flight. Outflows from Bitcoin addresses containing balances ranging from 100 BTC to 10,000 BTC totaled 648,000, representing the highest figure recorded since Feb. 5 and Feb. 6, during which exits surpassed 1 million and 905,000 BTC, respectively.
Long-term BTC holders demonstrate steadfast conviction
The present market correction exhibits characteristics that distinguish it from the selloff events witnessed during October 2025 and February 2026, periods when long-term holders proactively decreased their exposure amid price deterioration. Established Bitcoin holder cohorts are refraining from distribution at comparable velocities during this current retracement, maintaining a more substantial portion of supply in dormant states despite the breach of the $75,000 level.
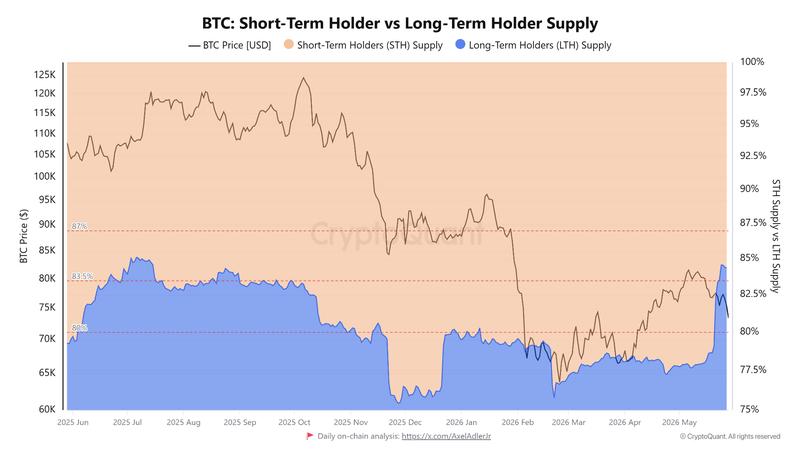
At present, long-term holders maintain control over 84.3% of Bitcoin's available circulating supply, mirroring concentration levels observed when BTC exchanged hands between $105,000 and $126,000 throughout Q3 2025. The absence of forceful selling behavior from these wallet addresses could potentially decelerate the velocity of additional downside momentum beneath the $75,000 mark.
Spot market trading activity for BTC has similarly experienced a pronounced cooling effect. According to market analyst Darkfost, Binance spot trading volumes contracted to $36.4 billion from a previous high of $198.6 billion recorded in October 2025, constituting an 81% reduction. Bitcoin spot volumes on a monthly basis stood around $84 billion throughout February before experiencing an additional $50 billion decline across the subsequent three-month period.
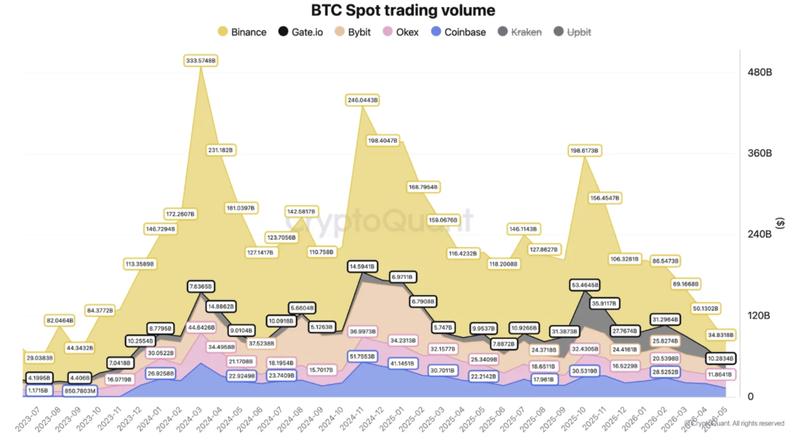
Diminished spot trading volumes frequently correlate with reduced immediate selling pressure flowing into markets, given that fewer coins actively transition between holders during episodes of weakened market participation. Comparable market conditions manifested near the conclusion of the 2023 bear cycle prior to the reemergence of volatility and strengthening trend dynamics.
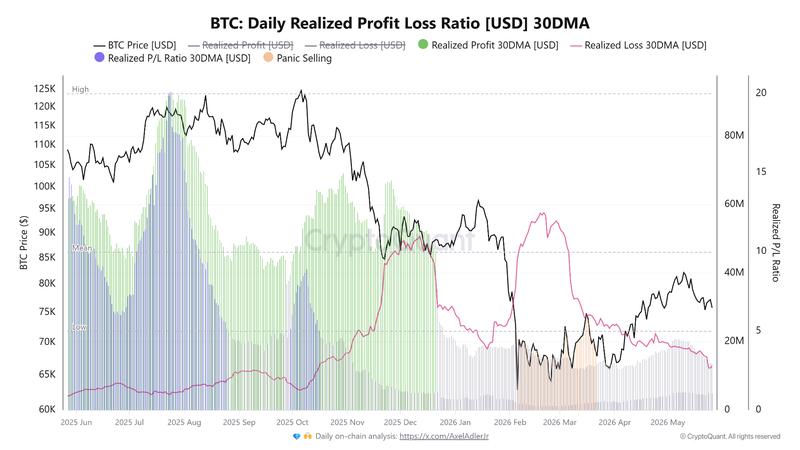
Realized losses for BTC have maintained their downward trajectory as fewer market participants executed Bitcoin sales at loss-making price points. The 30-day moving average metric for realized losses declined to $12.85 million as of May 26, down from $56 million recorded on Feb. 19, indicating diminished capitulation behavior in proximity to the $75,000 price zone.