
BTC Approaches Three-Week Low With Analyst Price Predictions Falling to $41K
BTC captured lower liquidity levels while tensions in oil supply pushed the cryptocurrency beneath $66,500, marking its weakest position since the 9th of March.

The flagship cryptocurrency Bitcoin (BTC) approached lows not witnessed in three weeks heading into the opening of Wall Street trading on Friday, occurring alongside news reports indicating Iran's closure of the Strait of Hormuz oil transportation route.
Key points:
- The cryptocurrency shows negative reaction to emerging threats to oil supply chains in advance of Friday's Wall Street market opening.
- BTC's price movement pursues bid-side liquidity, extending a week-long pattern of short-term liquidity hunting.
- An additional bear flag formation poses risk of pushing prices beneath the $50,000 threshold, according to technical analysis.
Bitcoin targets lower range levels approaching month-end closing
According to data sourced from TradingView, BTC price movement descended beneath the $66,500 level in the hours before Wall Street's trading session commenced.
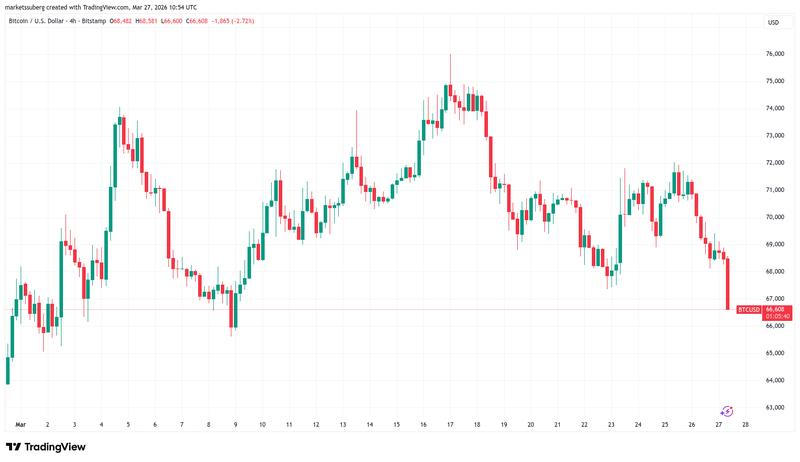
Futures contracts for American equities exhibited downward momentum while US WTI crude oil approached the $97-per-barrel price level as geopolitical stress showed no signs of abating.
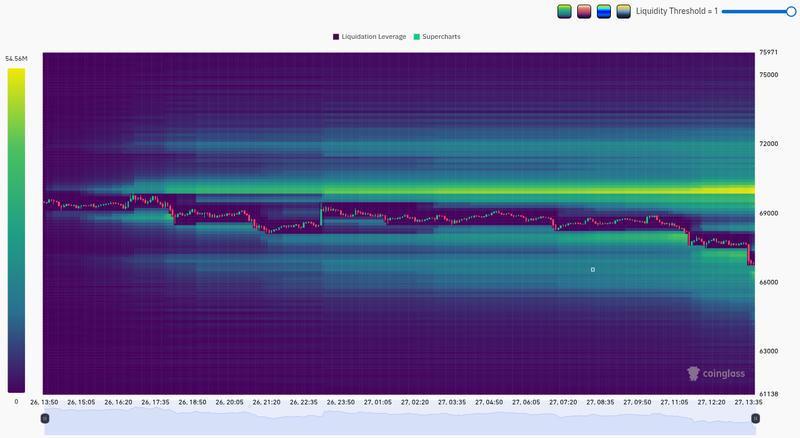
Information compiled by CoinGlass revealed BTC/USD consuming a sequential ladder of bid-side liquidity that stretches downward toward $65,000, while simultaneously a substantial barrier of ask orders maintained price suppression underneath the $70,000 psychological level.
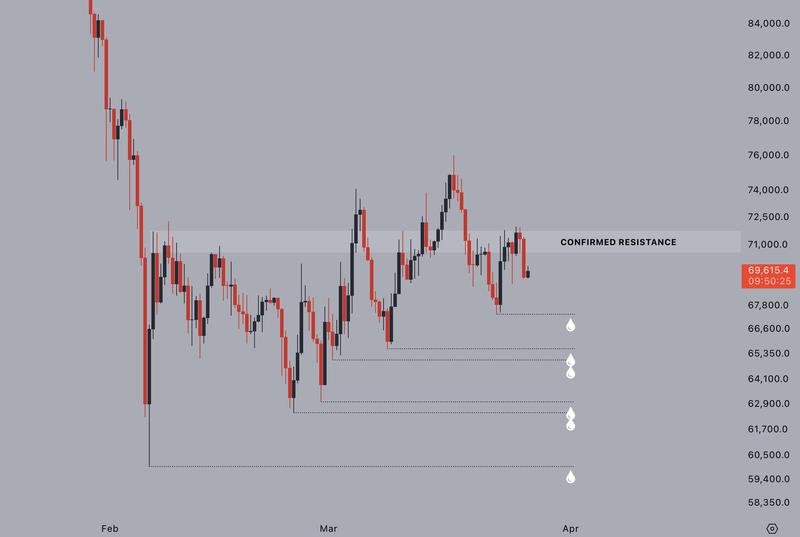
"$70-71k confirmed as resistance again," market trader Jelle expressed in technical analysis shared on X platform one day earlier.
"Still a bunch of liquidity built up below, generally not what you see at market bottoms. Expecting that liquidity to be taken out; sooner or later."
The most recent price action in the marketplace extended a recurring pattern of liquidity capture events observed across the entire week.
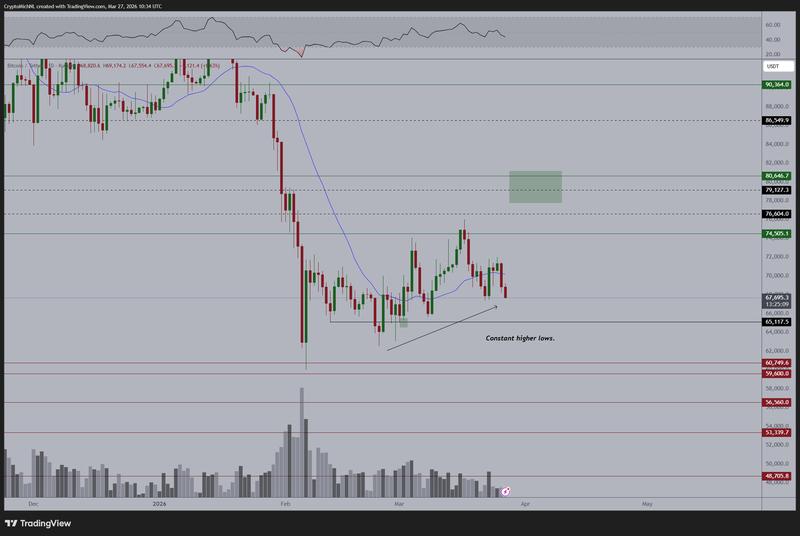
Adding to the commentary, cryptocurrency market trader Michaël Van de Poppe stated that he would remain "surprised" by additional BTC price deterioration heading toward the conclusion of March's monthly candlestick formation.
"Especially given that we're currently anticipating a potential sweep of the lows," he communicated to his X platform audience during the trading day.
"In that case, I remain to be interested to be buying in the lower $60K regions."
Bitcoin price receives $41,000 "measured target" projection
Examining extended time frame charts, market observers concentrated their attention on a potentially bearish breakdown from support levels associated with Bitcoin's second bear flag pattern formation observed in 2026.
Having initially manifested during January, the current bear flag technical pattern has generated price targets positioned below the $50,000 level.
"Bitcoin setting up for a rising wedge sell signal," experienced market trader Peter Brandt cautioned on Wednesday, aligning himself with those bearish projections.
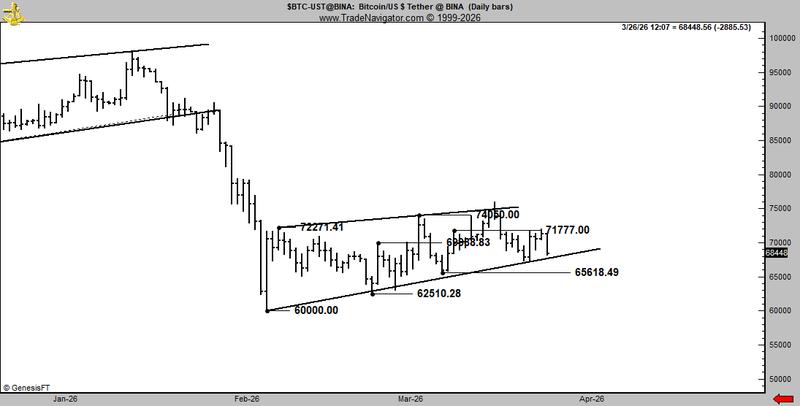
Through his personal X platform post, trading analyst and market educator Aaron Dishner maintained the pessimistic outlook surrounding the flag pattern structure.
"BTC is doing exactly what the bear flag setup called for. Price broke below the cloud yesterday on the daily, and today opened below it - currently down just 0.32% but that's not a recovery, that's hesitation," he remarked in his assessment.
"The measured target from the January 14th high to the February 6th low, applied to the current flag structure, puts the downside at $41K."