
BTC Approaches $80K Monthly Peak as Bullish Indicators Dominate Price Metrics
As Bitcoin edges toward the $80,000 threshold, futures market data reveals strategic trader positioning. Could profit-taking activity between $83,000 and $88,000 halt the upward momentum?

On Wednesday, Bitcoin (BTC) climbed to a monthly peak of $79,472, representing its most robust 28-day performance since April 2025. This upward movement coincides with notable changes in market positioning indicators and a significant increase in leverage utilization.
When examining both the market positioning indicator and open interest data together, evidence emerges that fresh positions are entering the market, which may be contributing to BTC's advancement toward unprecedented price levels.
Rising leverage accompanies BTC positioning growth
According to Bitcoin researcher Axel Adler Jr., the Bitcoin positioning index has experienced an upward turn, with its 30-day moving average climbing to 4.5 from a February reading of -10.9. This particular indicator combines multiple elements including net taker flow direction, trends in open interest, funding rates, and exchange balance to create a unified metric.
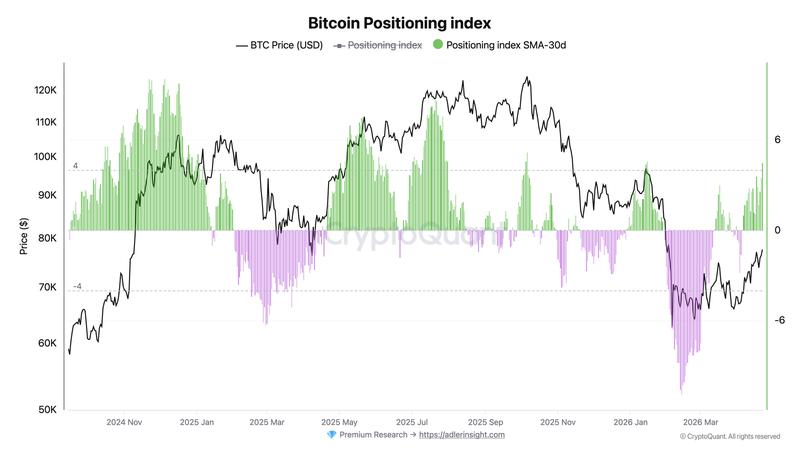
The indicator's continuous ascent from late March onward, advancing from 0.4 to present values, demonstrates sustained enhancement while maintaining the overall price trajectory.
Open interest expansion validates this identical pattern. The 30-day percentage change registers at +14.5%, featuring 23 positive closes out of the last 30 trading sessions. The combination of ascending positioning metrics paired with widening open interest points to fresh capital inflows into derivatives trading venues.
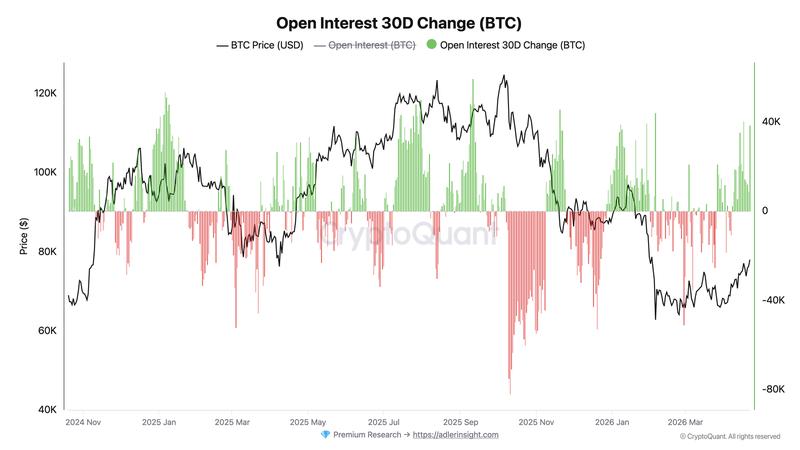
During the last 24-hour period, aggregate open interest increased by 6.7% to reach 260,000 BTC, whereas the price witnessed a 10.7% decline in leverage utilization over the weekend period.
Critical BTC price levels under observation
Bitcoin has successfully broken above a downward sloping trendline that originated from the October 2025 summit near $126,000 and has successfully recaptured the 100-day exponential moving average (EMA). This development suggests a powerful trend reversal from bearish sentiment to neutral-to-bullish conditions on extended time frames.
The $81,000 price point currently represents the initial testing zone, featuring a minor fair-value gap that reflects a liquidity imbalance, where maintaining price levels would demonstrate that market participants are willing to accept elevated valuations.
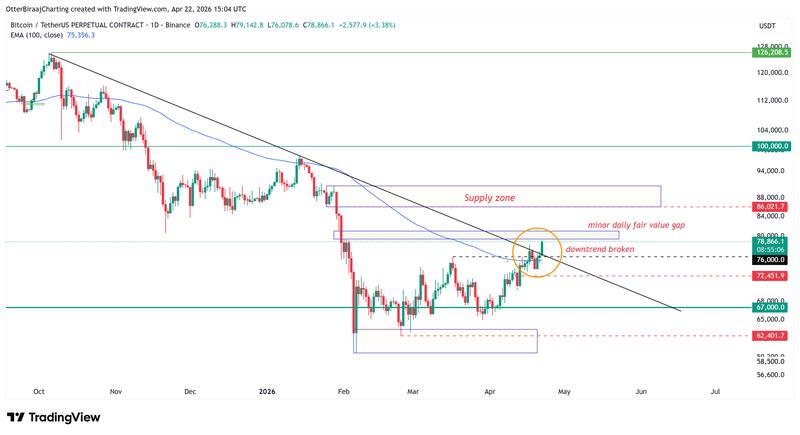
Beyond that threshold, $88,000 emerges as the supply zone connected to previous distribution activity. The $88,000–$91,000 range represents a significant supply zone, characterized by an earlier distribution phase during which substantial Bitcoin volumes were last transferred between participants.
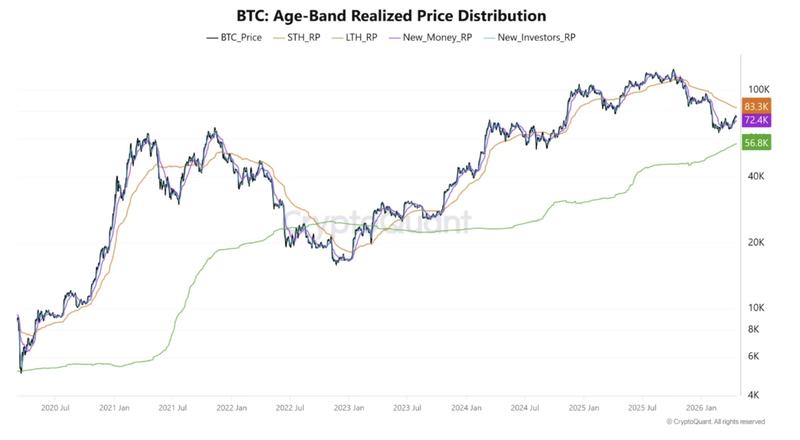
Numerous holders within this cohort currently find themselves approaching break-even or experiencing marginal profits, a situation that generally amplifies market activity whenever price action returns to that region.
Compounding this dynamic, the realized price for the three–to-six–month holder cohort registers at $91,600, which further solidifies this zone as a critical inflection point.
A prolonged movement through this price range would indicate robust demand conditions, demonstrating that purchasing activity is successfully absorbing the overhead supply and establishing conditions for Bitcoin price to advance further.
Crypto analyst Crazzyblockk identified a compressed trading range, where the $72,000–$75,000 zone functions as a support floor, underpinned by concentrated realized prices from intermediate-term holders. A breakdown beneath this band would force additional supply into unrealized losses, elevating the probability of reactive selling pressure.
On the resistance side, the $83,000–$85,000 range identifies a profit-taking zone for newer short-term holders. Price resilience moving through this territory would confirm that buying pressure is successfully absorbing available supply, enabling momentum to accumulate.