BTC Approaches 11-Week Bottom Following Higher-Than-Expected October Inflation Data
Cryptocurrency markets and equities experience initial decline as October CPI exceeds projections, leading market participants to anticipate Federal Reserve rate increase of 25 basis points next month.

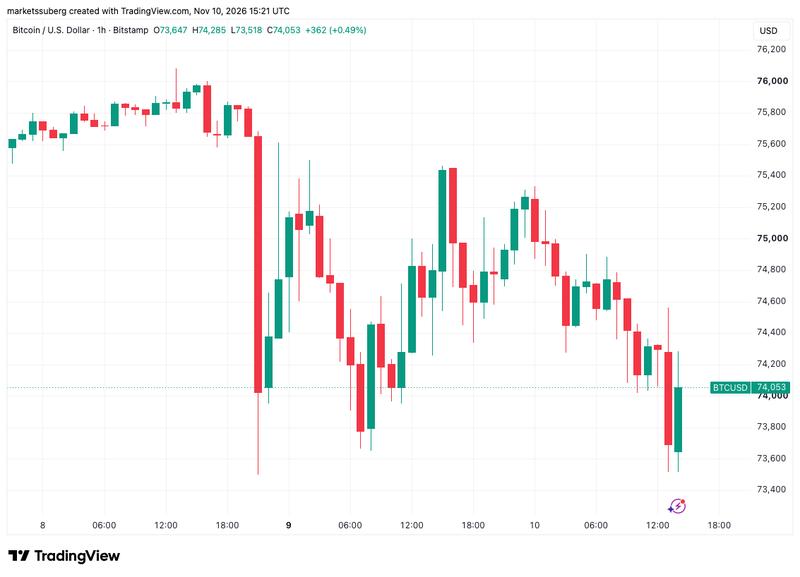
The world's leading cryptocurrency Bitcoin (BTC) experienced a decline toward its lowest levels in 11 weeks, approaching $73,500 during Tuesday's opening of US equity markets, following the release of inflation figures that surpassed analyst predictions.
Key points:
- The price action for Bitcoin descended to a low of $73,518 following the publication of US inflation statistics that came in higher than market forecasts, though prices subsequently recovered to trade above the $74,000 threshold.
- The Consumer Price Index for October registered at 0.4% on a month-over-month basis, exceeding economist expectations, even as energy price acceleration decelerated to 0.7% from the previous month's 5.2% reading.
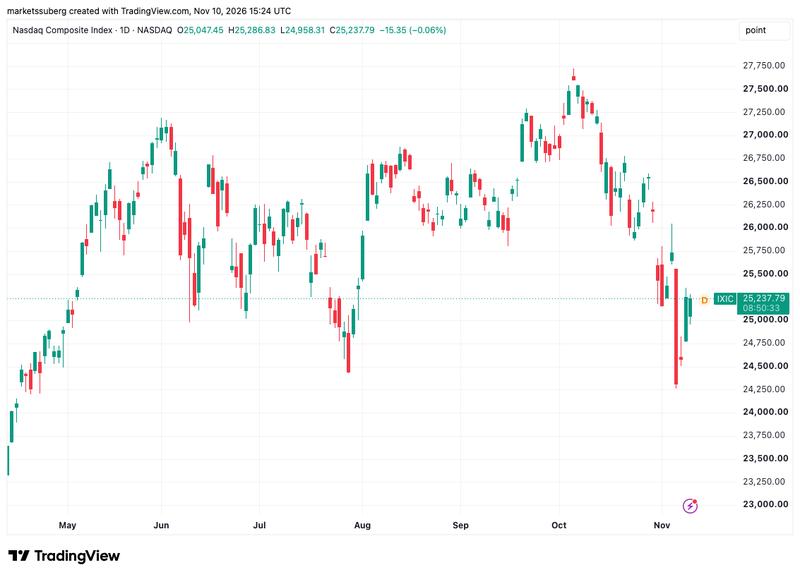
- Market observers identified the Nasdaq index as potentially establishing long-term bottom levels despite facing "extreme" selling pressure from market participants.
December Interest Rate Increase Priced Into Markets Following CPI Release
Chart data sourced from TradingView indicated that the BTC/USD trading pair declined to $73,518, coming close to replicating the depth reached during Sunday's trading session, representing its weakest performance since Aug. 21.
The Consumer Price Index (CPI) reading for October registered at 0.4% on a monthly basis, surpassing the consensus forecast of 0.3%. The CPI report did not include year-over-year comparative data due to the disruption in statistical gathering that occurred during last year's US government shutdown, but the data nevertheless revealed a deceleration in the pace of price increases compared to September, which had recorded a monthly gain of 0.6%.
The index for shelter rose 0.3 percent in October, accounting for over thirty percent of the monthly all items increase. The food index increased 0.5 percent in October, as the food at home index rose 0.4 percent and the food away from home index increased 0.5 percent
Bureau of Labor Statistics (BLS) official release
While the September CPI reading had been heavily influenced by surging energy costs, the October energy index demonstrated a considerably more modest advancement of 0.7% compared to the prior month's substantial 5.2% increase.
Economic analyst Robin Brooks characterized the inflation data as "discouraging" while acknowledging that petroleum price increases had been a significant factor in the elevated September figures.
All the details of this CPI report are discouraging, but October was also the peak of the second big oil price shock this year and that's obviously going to bleed into core CPI inflation
Robin Brooks, economist
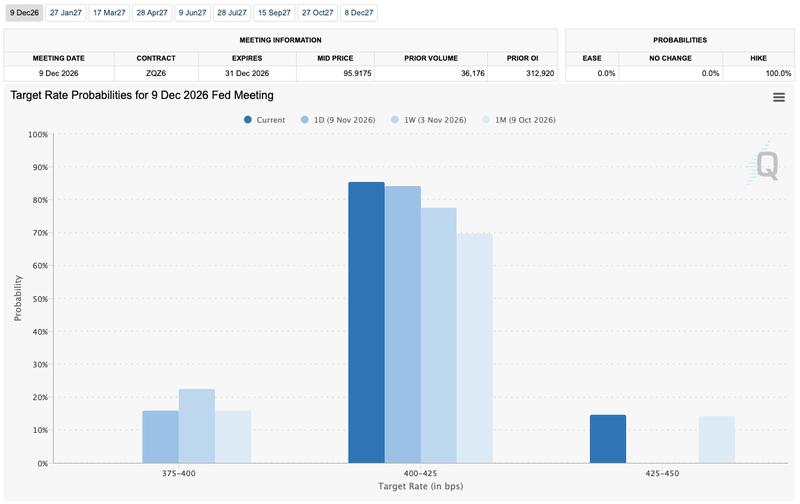
During remarks delivered earlier on Tuesday, Federal Reserve governor Christopher Waller indicated his support for a 25 basis point increase to interest rates at the December policy meeting, regardless of whether inflation showed improvement from September levels. Market probability data from CME Group's FedWatch Tool demonstrated that traders were assigning a 96.3% likelihood to such an outcome prior to the CPI release.
In the aftermath of the inflation report, market expectations shifted in a more aggressive direction, with a quarter-point rate hike now commanding 85.3% probability while a 50-basis-point increase garnered 14.7% odds.
Market Analysts Identify "Extreme" Selling Pressure on Technology Index
American equity markets faced downward pressure at the commencement of Wall Street trading as the inflation figures compounded existing challenges confronting market bulls. Additional headwinds included robust employment market statistics and the potential for stricter regulatory oversight of the artificial intelligence sector following Democratic victories in both the House and Senate.
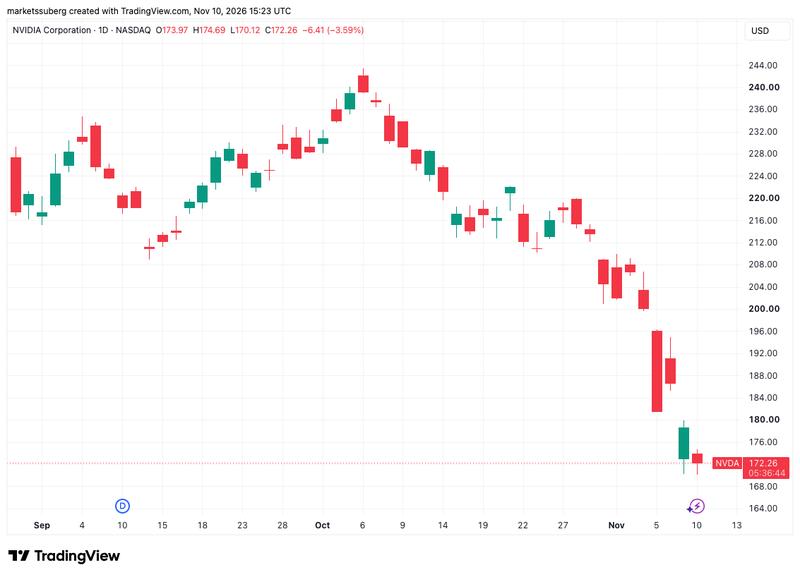
The technology-focused Nasdaq Composite Index initiated trading with a 0.6% decline before subsequently recovering those losses, while shares of Nvidia experienced a nearly 4% drop amid an ongoing board inquiry examining whether CEO Jensen Huang had been subject to targeting by foreign intelligence operatives.
Consumer inflation has continued running above target while the October jobs report removed any concerns about a slowdown in the labor market
Mosaic Asset Company
Despite the challenging environment, Mosaic identified indicators suggesting "extreme" selling activity affecting the Nasdaq, which could potentially indicate that the technology index has established a durable price floor.
That includes a spike in the equity put/call ratio which jumped over 1.0 and is even higher than during the trade war selloff in April 2025
Mosaic Asset Company