
BTC Analysts Anticipate Additional Decline Toward $46K Price Level
Following a failed attempt to maintain position above the 200-week EMA, Bitcoin confronts potential additional losses with experts cautioning about drops beneath $50,000.

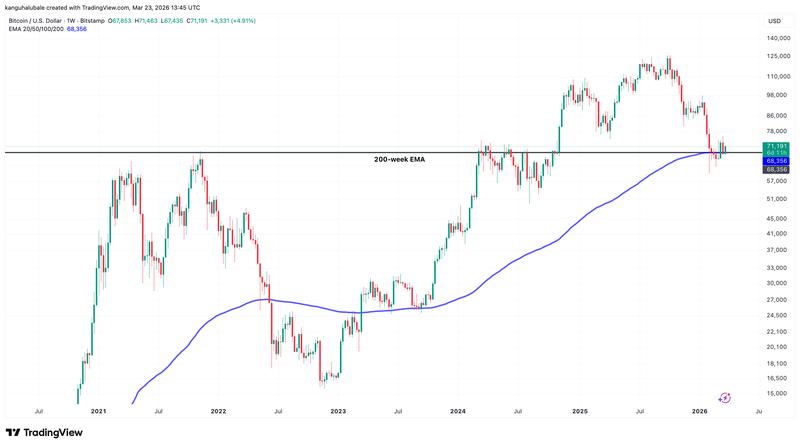
The inability of Bitcoin's (BTC) price to secure a weekly close above the 200-week exponential moving average (EMA) on Sunday has placed the cryptocurrency in danger of experiencing another downward movement in the weeks or months ahead.
Key takeaways:
- Bitcoin's price action demonstrates "structural weakness" following its inability to secure a weekly close above a critical trend line.
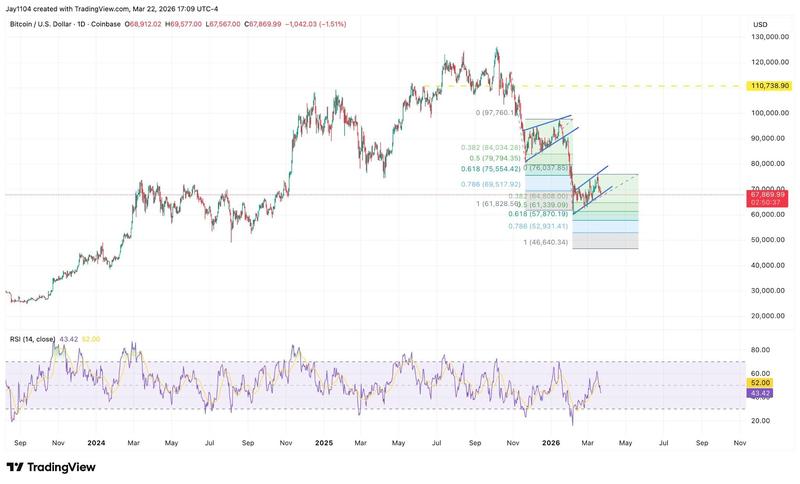
- Market experts indicate that the upcoming breakdown creates conditions for another potential selloff moving toward $46,000.
- A significant structural support zone for Bitcoin exists at the $47,000 price point.
Bitcoin's price vulnerability triggers forecasts below $50,000
Information from TradingView indicated BTC/USD was exchanging hands at $71,190, representing a 6% increase from its intraday bottom of $67,300.
The trading pair was unable to secure a weekly close beyond the 200-weekly EMA on Sunday, which currently stands at $68,300, indicating that the previous week's recovery rally to $76,000 may have been a potential bull trap.
Signs of profit-taking emerge whenever Bitcoin climbs to significant accumulation zones, and while discussing the present market conditions, numerous traders cautioned that any potential downside movement could accelerate rapidly.
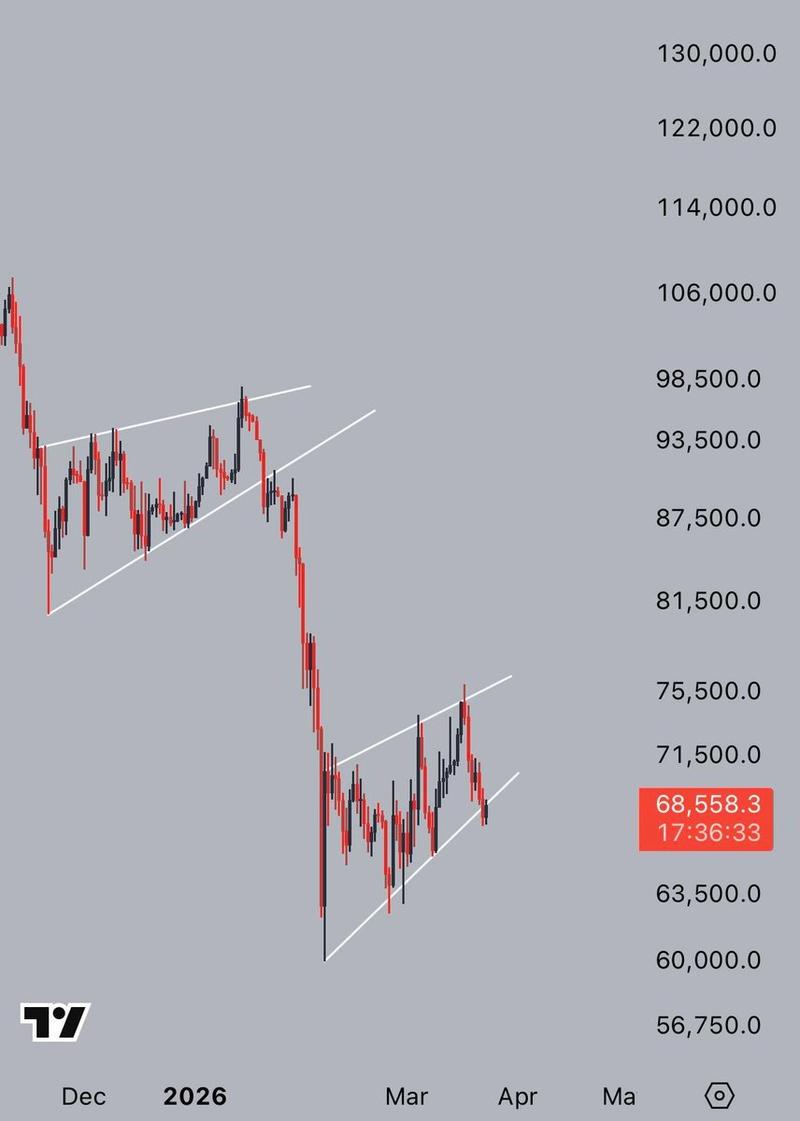
"$BTC broke down from the rising wedge over the weekend," said analyst Jelle in a Monday post on X, adding:
"Consolidate here for a day or two, and those untapped lows look ripe for the taking."
The analyst was referring to the area between the local low of $65,500 and the range low of $59,930 reached on Feb. 6.
"BTC has lost the EMA50 once again, and the global crisis feels more insecure today than it did 2 weeks ago," fellow analyst Stockmoney Lizards said in the latest Bitcoin analysis on X.
When combined with the technical weakness observed, "it looks like we could be revisiting the sub-$60K area," the analyst added.
"Bitcoin is getting close to taking that next leg lower into the mid-$40Ks," analyst Michael J. Kramer said, referring to the measured target of a bear flag around $46,600.
Such price targets align with prediction market traders, who price in a 70% chance that Bitcoin drops below $55,000 in 2026, while placing the odds of a drop below $45,000 at 46%.
Bitcoin's "deep structural" support zone positioned at $47,000
Bitcoin's current trading occurs near the 200-week EMA at $68,300, which aligns with the realized price of the "largest holder cohort (100-1K BTC)," according to CryptoQuant analyst Axel Adler Jr.
"As long as the price holds above $68K, the largest cohort remains near its cost basis and maintains a more resilient position," Adler Jr. said in a Bitcoin analysis on Monday, adding:
"A move below this level would signal deteriorating structure and increase the likelihood of a more nervous reaction from large holders."
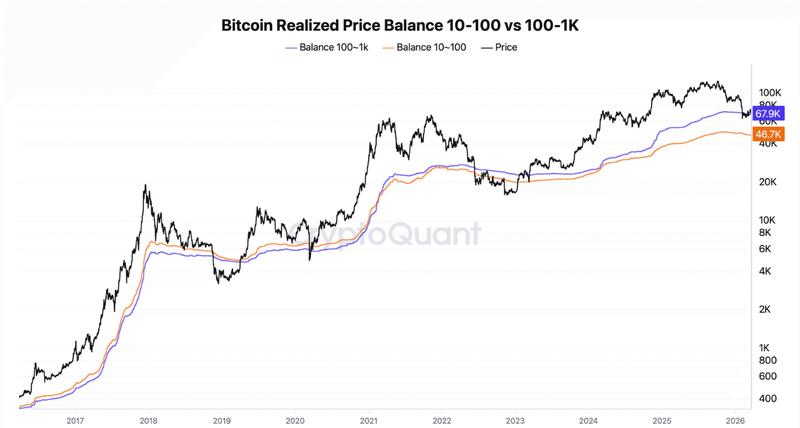
In the meantime, the realized price for the 10-100 BTC holder cohort is positioned considerably lower around $46,700, establishing a "deep structural threshold that would become meaningful only in the event of a full-scale deterioration in market regime," the analyst added.