
Bitcoin's Negative May Performance Signals Potential 10% Decline Ahead
With Bitcoin poised to close May in negative territory, historical patterns suggest further downside could be on the horizon, as past data shows similar red months often precede additional losses.

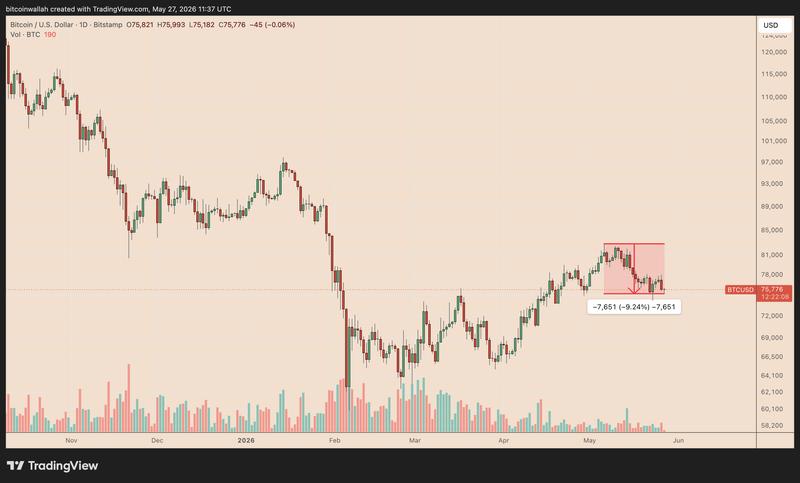
Bitcoin (BTC) appears to be validating the traditional "sell in May and go away" market adage, as the cryptocurrency has shed approximately 10% following its failure to break through the $83,000 resistance level and is currently heading toward a negative monthly closing.
Key takeaways:
- BTC's average returns a month after a red May are -10%
- Patient Bitcoin holders still generated positive returns over the longer term.
Negative May closings historically precede sluggish summer performance for Bitcoin
The well-known Wall Street adage "Sell in May and go away" originates from the observation that equity markets frequently deliver stronger performance during winter months compared to the summer period.
As an example, the S&P 500, the benchmark US stock index, has posted average returns of -0.24% one month following red Mays and -2.25% three months later since 1990, though markets have historically recovered to show gains of +1.22% after six months and +7.44% over a 12-month period.
Bitcoin's historical May performance reveals comparable near-term cautionary signals. BTC recorded negative returns during May in 2013, 2015, 2018, 2021, 2022, and 2023. The average performance one month following these red Mays was -10.1%.
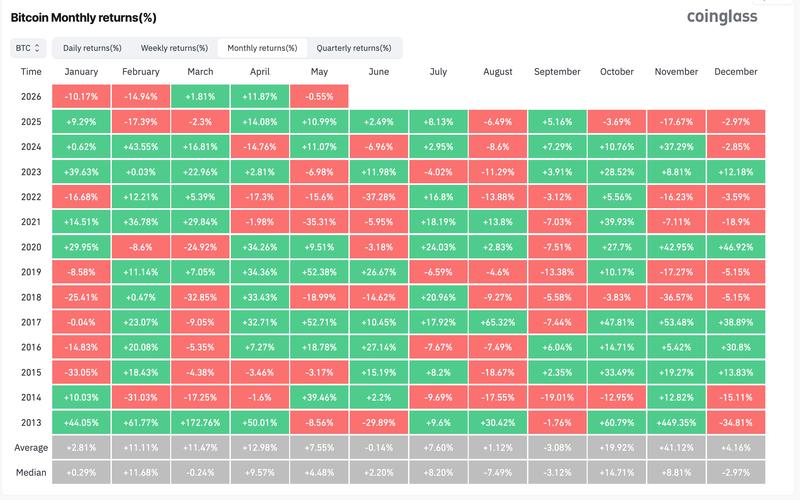
The average return over a three-month timeframe was similarly negative at approximately -3.3%. This data suggests that BTC generally fails to mount a substantial recovery during summer months following May declines. These statistics reinforce the notion that a negative May closing can serve as a near-term capitulation indicator.
However, mirroring the pattern observed in traditional US equities, the extended-term outlook appears considerably less pessimistic.
Looking at the six-month horizon after a red May, BTC's average return surges to approximately +139%, though this figure is significantly influenced by the exceptional late-year surge witnessed in 2013. When this statistical outlier is removed from the calculation, the six-month average declines substantially to around +12.9%.
Using Bitcoin's current trading price of approximately $75,850 as a baseline, the historical average performance following negative May closings suggests a potential decline to around $68,200 by June and approximately $73,350 by August.
The six-month historical average projects a potential price of nearly $181,300 by November, although this projection is substantially skewed by the 2013 anomaly. When that outlier year is excluded, the six-month price target drops to a more conservative $85,600.
Relying solely on these historical patterns, investors with a long-term Bitcoin investment horizon have minimal justification to adopt the "sell in May and go away" strategy.
The historical evidence suggests near-term price weakness rather than a fundamental collapse of BTC's overarching bullish trajectory.
Red May closings during bear markets posed greater risks for Bitcoin
Should Bitcoin finish the month trading beneath $76,000, this red May candlestick will form within what appears to be a bear-market framework.
During 2018 and 2022, May losses failed to establish an immediate price bottom. Both years exhibited clear bear cycle characteristics, with BTC trading beneath critical support levels and establishing a pattern of descending highs and descending lows.
Following these negative May closings, Bitcoin declined an average of 26% over the subsequent month, 21.6% over the following three months, and approximately 46% over the next six months.
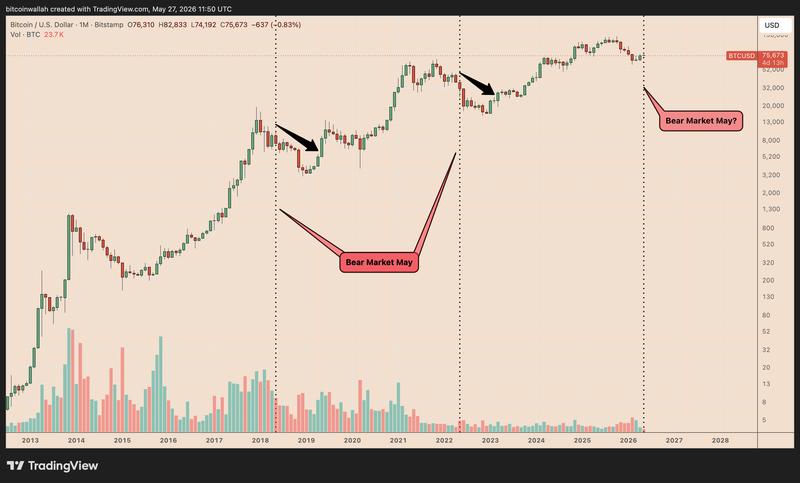
During typical market conditions or inter-cycle periods, a red May has generally indicated temporary weakness rather than a complete reversal of the dominant trend. However, within established bear markets, this identical signal has historically foreshadowed more severe capitulation events.
As of now, 2026 has not been definitively established as a Bitcoin bear-market year.
During previous bear market cycles, BTC initially violated major cycle support levels, specifically around $6,000 during 2018 and the $30,000–$32,000 range in 2022, before experiencing deeper capitulation phases.
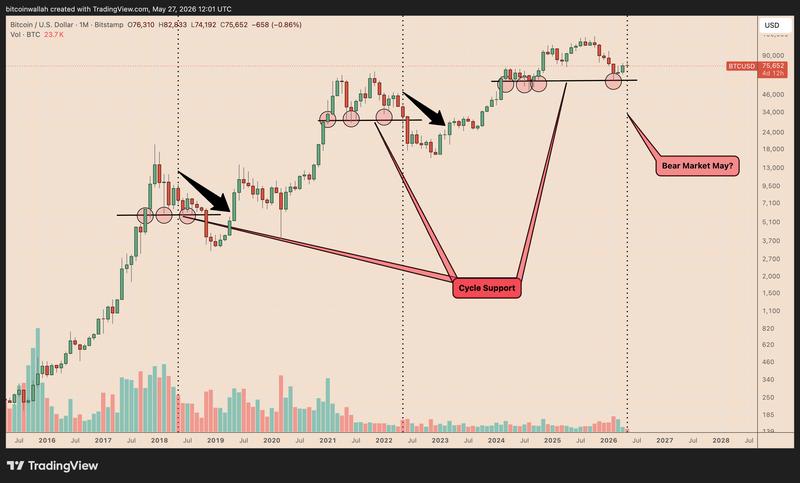
BTC continues to trade around $75,000, maintaining a position above its present cycle support level located near $60,000. A monthly closing below this threshold would provide additional confirmation for the bear-market hypothesis.
A monthly close falling beneath the $70,000–$72,000 range would similarly provide encouragement to bearish market participants, while a more pronounced breakdown below the $60,000–$65,000 zone would make it increasingly difficult to characterize the current downturn as simply a temporary correction.