
Bitcoin Weekly Outlook: Investor Disagreement on Rate Trajectory Persists
As US inflation figures and US-Iran conflict developments maintain uncertainty in risk markets, Bitcoin market participants brace for multiple volatility drivers ahead.
As July draws to a close, Bitcoin (BTC) finds itself navigating multiple sources of volatility while the Federal Reserve responds to inflation pressures in the United States.
Key points:
- The Federal Reserve's upcoming interest rate announcement arrives amid rising US bond yields, with market participants viewing a September increase as probable.
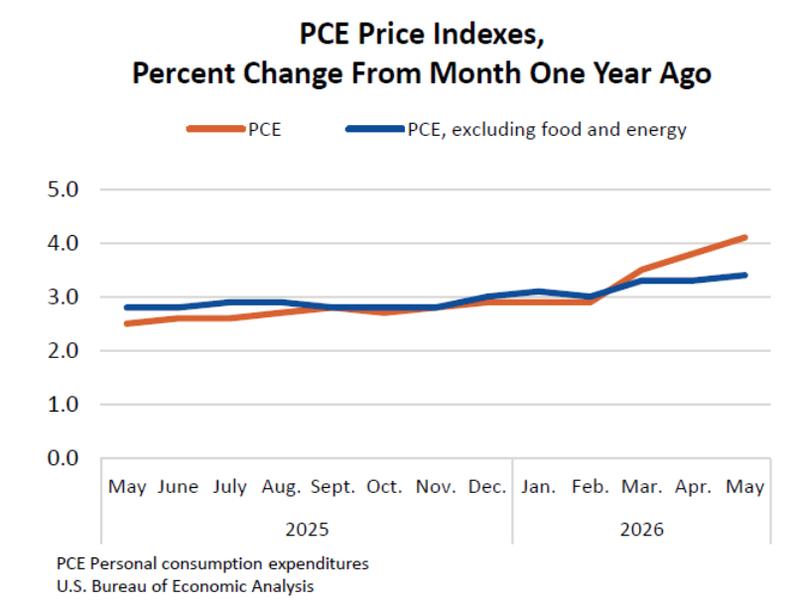
- Thursday brings the June PCE inflation report following last month's three-year peak of 4.1%
- Emerging signals of an equity uptrend reversal heighten attention on Bitcoin's correlation with traditional markets.
- Whale-driven exchange deposits have declined 44% compared to June levels
Rate trajectory outlook divides market participants
Focus returns to the United States Federal Reserve during the coming days, as the Federal Open Market Committee (FOMC), under the leadership of Kevin Warsh, prepares to reveal its most recent interest rate determination on Wednesday, July 29.
The convergence of geopolitical instability and continuing inflationary forces has transformed projections for Federal Reserve monetary policy and reintroduced the prospect of additional rate increases as the two-year US Treasury yield reached 4.3% during the previous week. According to current information from CME Group's FedWatch Tool, there exists a 31% probability of an increase this week, while odds for a hike during the September gathering stand at approximately 50%.
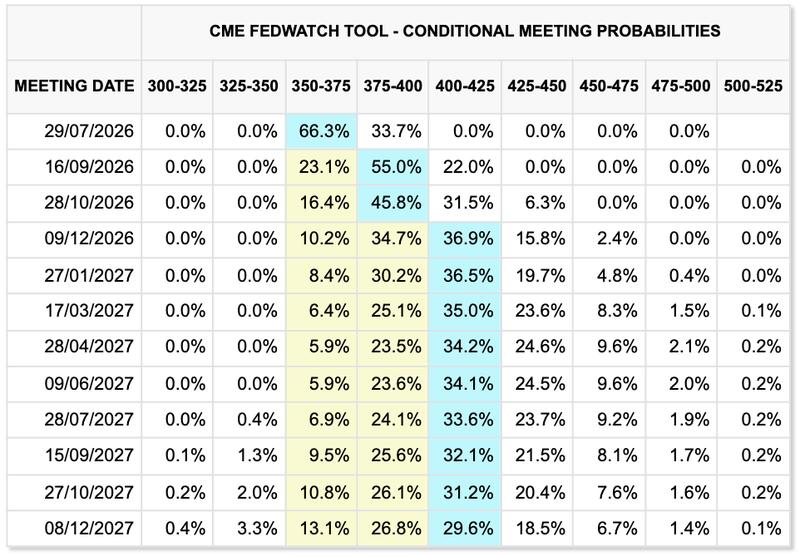
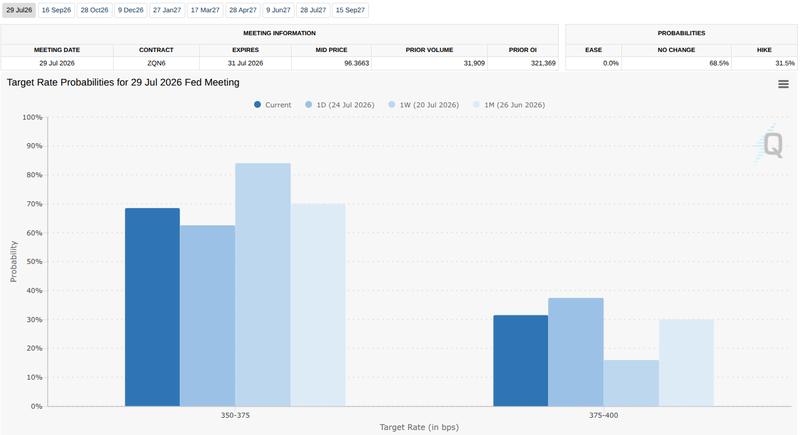
Expectations for rate increases experienced modest moderation when crude oil values fell 8% during Monday's early trading hours following a temporary cessation of strikes between the US and Iran. Consequently, rate hike probabilities adjusted downward from 37.4% to 33.7%. Developments continuing to unfold across the Middle East therefore maintain their role as volatility catalysts within the broader macroeconomic landscape, despite Producer Price Index inflation figures released earlier this month arriving beneath market forecasts.
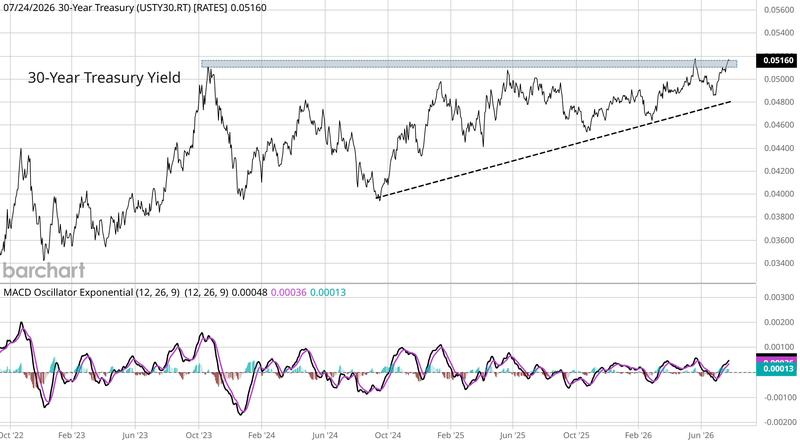
In their analysis, trading resource Mosaic Asset Company highlighted an impending upward breakout in 30-year bonds. While the long end of the bond curve currently holds a reduced position in financing US government operations, this development could theoretically increase pressure on Warsh as he crafts his messaging during the post-FOMC press conference.
Prior to the most recent upheaval, newly appointed Fed chair Warsh had maintained a hawkish stance regarding the economic situation and delivered his post-FOMC statement and press conference in characteristically concise fashion.
"Inflation remains elevated relative to the Committee's 2 percent goal, in part reflecting supply shocks that have driven price increases in certain sectors, including energy," he said at the time.
PCE inflation projected to decline from three-year peak
In addition to the FOMC announcement, market observers will closely monitor the Personal Consumption Expenditures (PCE) index scheduled for Thursday to obtain updated indicators regarding the US-Iran war's influence on inflationary patterns. The index's June measurement currently registers at three-year peak levels.
Fluctuations in PCE readings can trigger immediate consequences for risk-asset valuations as market participants recalibrate their expectations for potential Federal Reserve responses. The June data release occurred simultaneously with Bitcoin descending to macro support zones near $58,000.
Introducing its most recent forecast, the International Monetary Economics Network (IMEN) anticipated that PCE would register moderately beneath May's 4.1% year-on-year figure. "U.S. inflation: We currently expect June PCE inflation to be 3.7% year‑over‑year," it wrote on X.
Bitcoin-equity correlation remains notably weak
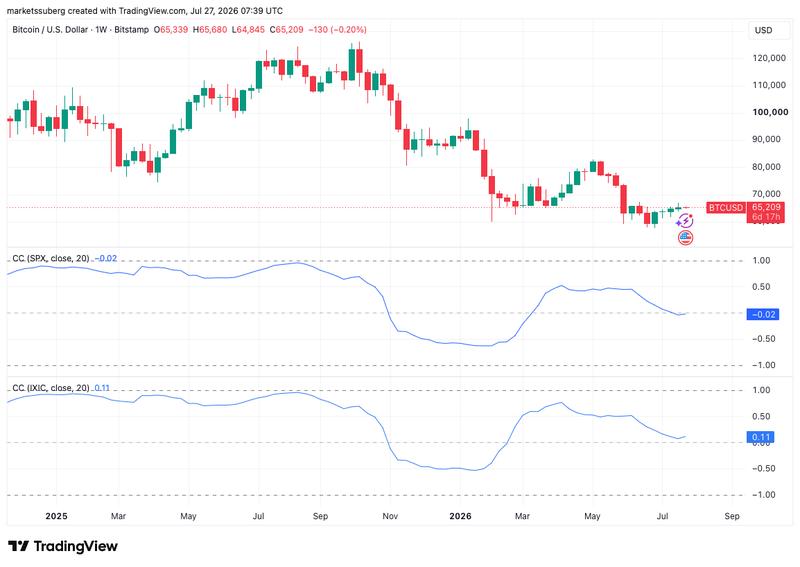
When examining higher timeframes, correlative relationships between Bitcoin and primary equity benchmarks have effectively vanished. Information from TradingView currently indicates the daily correlation between BTC/USD and the S&P 500 using a 20-week lookback period as virtually nonexistent, reaching its weakest point since March. In comparison with the technology-concentrated Nasdaq Composite Index, the present correlation coefficient of 0.11 represents levels last witnessed during mid-February. Although correlations measured on weekly intervals adjust gradually, adverse geopolitical and macroeconomic developments possess the capacity to synchronize movement between these two asset categories once more.
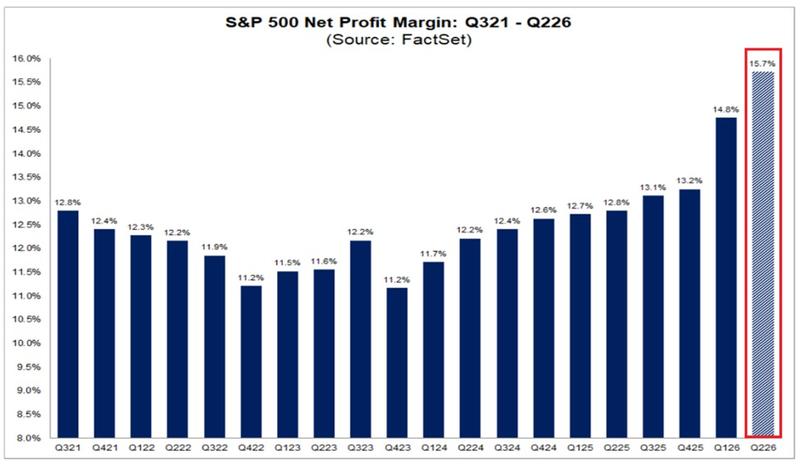
At present, corporate earnings releases throughout the United States have persistently exceeded market projections. Nevertheless, considering the historically elevated valuations currently in place, this achievement seems unlikely to provide protection against possible market corrections. Multiple prominent US technology stocks experienced substantial declines throughout the previous week. The Magnificent 7 collectively declined by 5.3% through Friday's close following earlier sell-offs affecting $GOOGL and $TSLA earlier during the week.
Despite these setbacks, "Alphabet, $GOOGL, is the single largest margin contributor after significantly beating earnings estimates," the Kobeissi Letter commented on the topic at the weekend.
"Meanwhile, 86% of reporting S&P 500 firms have so far beaten EPS estimates, while 80% have exceeded revenue expectations. AI is driving historic earnings growth."
Mosaic Asset Company drew attention to the dangers that the current rate environment might impose on United States equity markets.
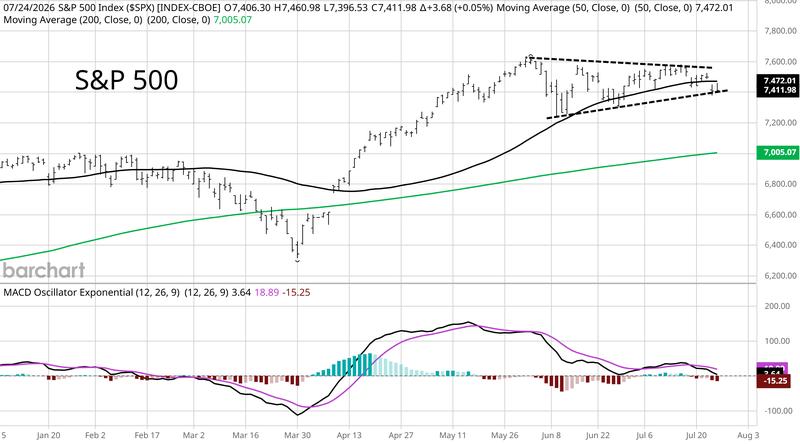
"Rising rates across the yield curve could keep pressuring stock prices, where indexes like the S&P 500 and Nasdaq peaked in early June and are now losing key support levels. At the same time, market breadth is deteriorating while the backdrop for seasonality is transitioning from a bullish tailwind to bearish headwind. Seasonality during mid-term election years also tends to produce lower average returns and larger drawdowns."
Given these developing obstacles, the S&P 500 faces the danger of completely abandoning its bullish structure, according to Mosaic's assessment.
"The S&P already lost one key support level with the 50-day moving average (MA - black line). If trendline support in the triangle gives way, that could set up a test of the 200-day MA (green line) that's currently near the 7,000 level (or 5% downside from current levels)," it added alongside an explanatory chart.
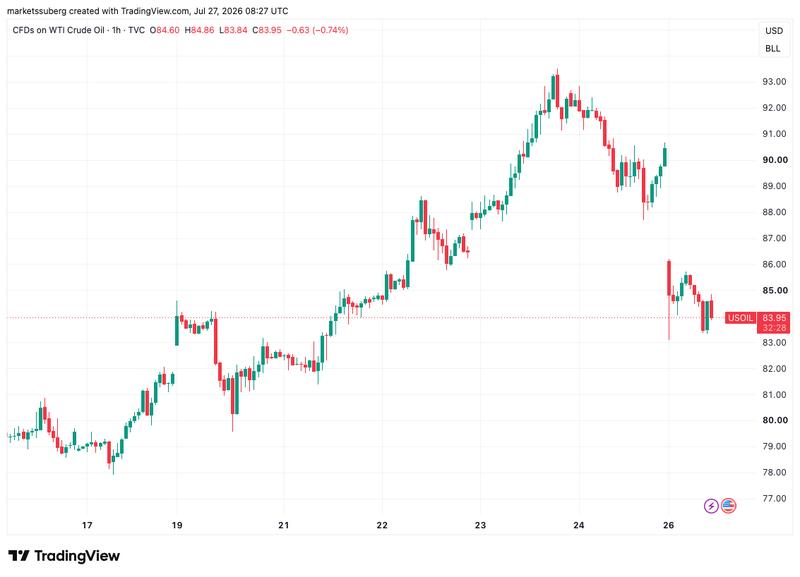
Examining shorter time intervals, the situation continues to evolve, with a temporary suspension in confrontations between the US and Iran delivering a bullish catalyst throughout risk asset categories. US WTI crude oil descended to lows of $83 per barrel during the week's opening, having previously approached $95.
"The market is beginning to price-in a peace deal again," Kobeissi responded.
BTC price action within "boring" range challenges 50-month trend line
Following Sunday's weekly close, Bitcoin proceeded to establish fresh local peaks, achieving $65,680 on Bitstamp. Remaining confined within a recognizable trading range, BTC/USD confronted its 50-month exponential moving average (EMA) trend line, having previously converted it into resistance through a movement mirroring the 2022 bear market pattern.
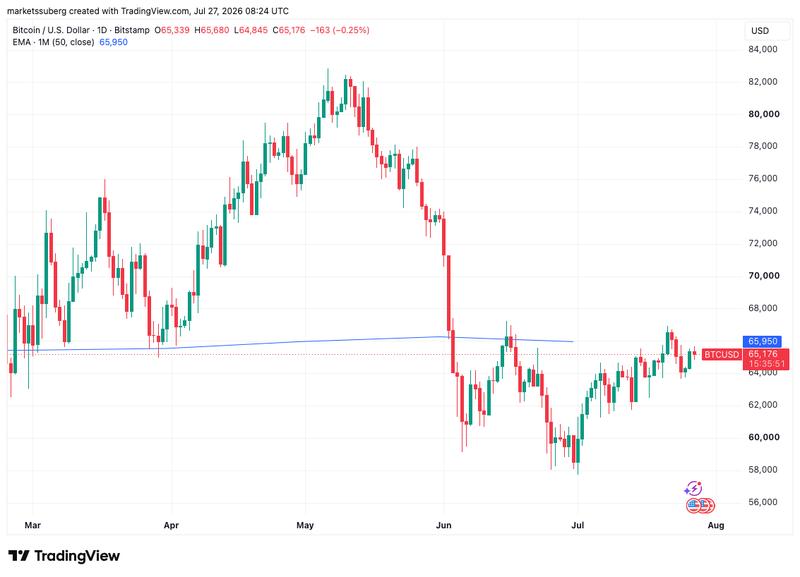
Providing commentary on the present market configuration, trader and analyst Rekt Capital identified intensifying sell-side pressure.
"The more seller-dominant the volume becomes while Bitcoin is at resistance, the greater the chances for a rejection from here," he warned X followers on Sunday.
Rekt Capital incorporated the 200-week simple moving average (SMA) into his analysis, characterizing price action as "sandwiched" between it and its 50-month equivalent.
"Continued price compression here is unsustainable and will eventually force major volatility," he forecast.
"And if the seller volume keeps coming in at this rate, then there'll likely be a breakout on seller volume to precede a rejection from this local resistance area."
Whale deposits to Binance experience nearly 50% reduction since mid-June
Providing perspective on the FOMC meeting and its potential influence on cryptocurrency markets, onchain analytics platform CryptoQuant anticipates a possible secondary effect on sell-side pressure across major exchanges.
Based on their tracking data, BTC deposits from whale addresses to Binance have decreased by as much as 44% since June 12, whereas retail deposits declined 22%.
"This leaves retail inflows at roughly twice the level of whale inflows, with a gap of $3.9 billion," contributor Amr Taha wrote in a blog post on Monday.
"The divergence suggests that the composition of BTC transfers into Binance has shifted: retail participants are currently significantly more active than whales in sending BTC to the exchange."
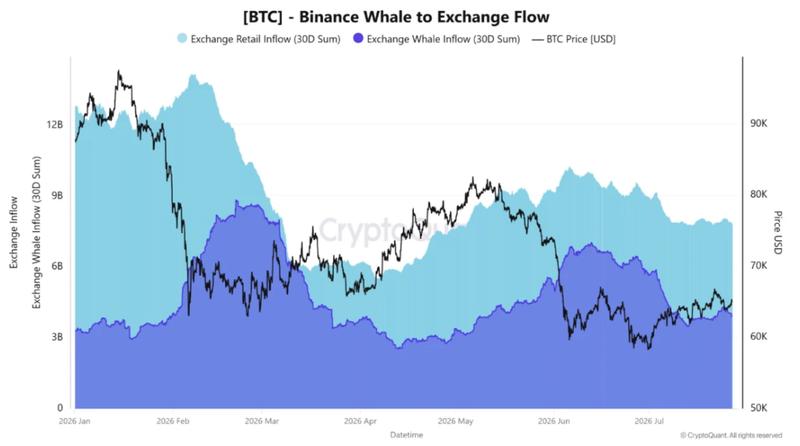
Taha characterized the FOMC meeting as a "major macro catalyst" possessing the potential to transform how all investor categories approach the market environment.
"With retail inflows now running at 2x whale inflows, Wednesday's Fed decision could provide an important test of whether the current divergence between the two BTC cohorts persists or begins to converge," he concluded.
As Cointelegraph reported, Binance saw single-day withdrawals of over 9,000 BTC last week.