
Bitcoin 'W' Bottom Formation Signals Potential Bear Market Conclusion, Says Bollinger Bands Inventor
The inventor of Bollinger Bands, John Bollinger, indicates that Bitcoin's emerging reversal pattern may have the potential to 'break' the prevailing downtrend as BTC shows renewed strength.

A prominent market analyst is observing that Bitcoin (BTC) appears to be forming a "perfectly fractal" reversal structure that may signal the conclusion of the bear market cycle.
Key points:
- Bitcoin is currently forming the concluding phase of what may develop into a significant "W"-shaped reversal structure.
- John Bollinger indicates that successful completion of this pattern has the potential to "break" the downward trend that has persisted since October 2025.
- Institutional buying activity is gradually resuming while the recently regained $60,000 level maintains its position.
John Bollinger hints BTC price "W" reversal could break bears
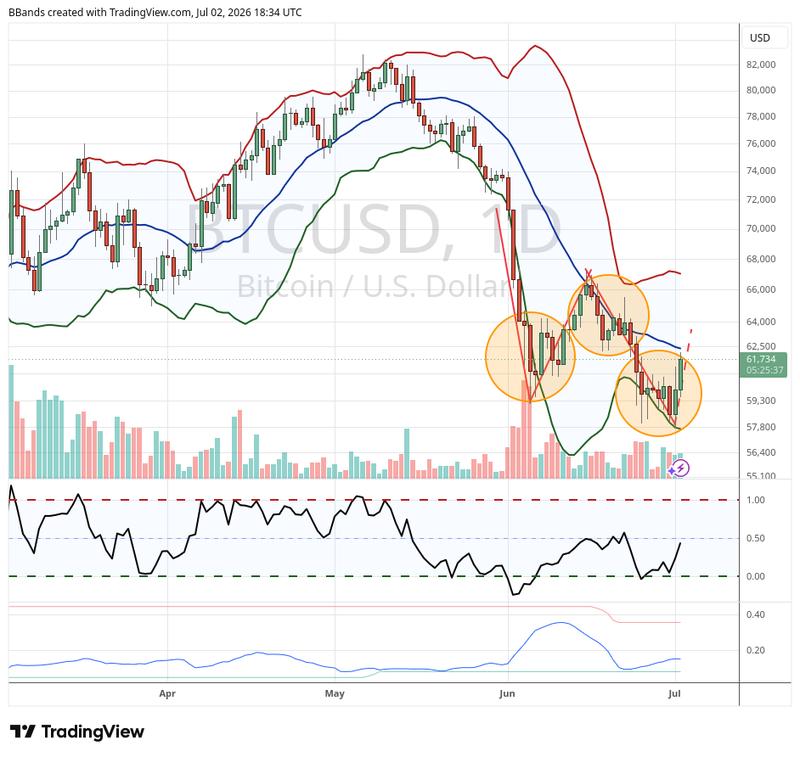
Through a series of posts on X platform this past Friday, John Bollinger, the renowned creator behind the Bollinger Bands volatility measurement tool, identified a "W"-shaped double bottom formation developing on the BTC/USD trading pair.
"$BTC has seen a series of bullish patterns broken, evidence of the power of the downtrend," he commented.
"Will this 'W' be the one that breaks the trend?"
The "W"-shaped reversal formation consists of two distinct swing lows separated by a rebound attempt that gets rejected, followed by price action that eventually penetrates through that rejection threshold to establish a fresh upward trend.
A chart shared by Bollinger demonstrated the precise alignment between the current price action and the lower boundary of the Bollinger Bands indicator when viewed on daily timeframe charts.
"Note that it is perfectly fractal. The are small 'w's at the nadirs and a small 'm' at the apex," he added, also pointing to a "W" on the weekly chart.
Bollinger's optimistic stance on BTC is not a recent development. Earlier in May, he disclosed initiating a fresh long position through his Bitcoin-focused investment instrument.
According to previous Cointelegraph coverage, a growing array of technical price indicators are displaying signals that haven't appeared since the previous bear market cycle witnessed in 2022. Nonetheless, the broader market consensus among participants suggests that the ultimate macro bottom remains ahead and is anticipated to materialize during Q3 or in subsequent months.
Bitcoin ETF inflow comes amid major supply "absorption"
In related developments, market analyst Axel Adler Jr., who contributes analysis to the onchain analytics platform CryptoQuant, highlighted the importance of institutional buyer interest making a comeback.
This past Friday marked the first occasion in ten days that the US spot Bitcoin exchange-traded funds (ETFs) recorded net positive inflows.
"Bitcoin is in the late stage of the bear cycle, but the ETF segment has for the first time signaled that the pressure is easing," he summarized on X.
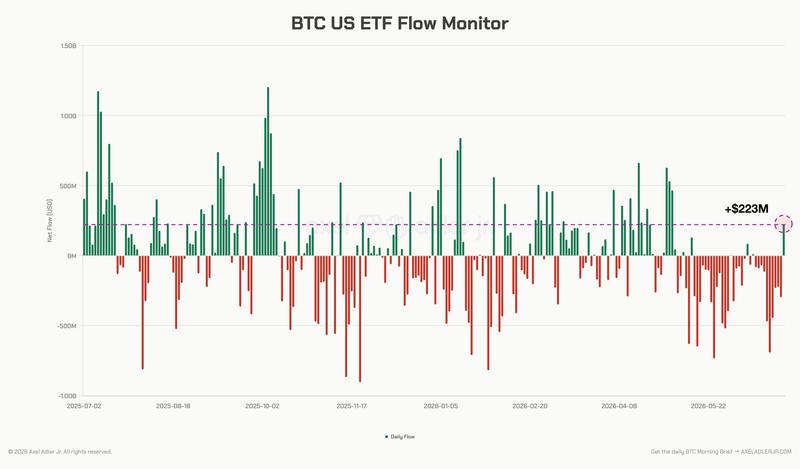
Market trader Daan Crypto Trades recognized that despite the $220 million in inflows being "not massive," these flows might carry important implications for Bitcoin price stability and support moving forward.
"Also good to note how price has been holding this ~$60K region regardless of the many outflows. That will become meaningful if price does bounce further into next week as it means a lot of absorption has taken place," he told X followers.