
Bitcoin ETF Flow Analysis: Silent Accumulation or Strategic Pause in Selling?
Four consecutive months of outflows have characterized spot Bitcoin ETFs, with total holdings declining by 85,000 BTC since October 2025. Does weakening institutional appetite spell doom for BTC's price performance?

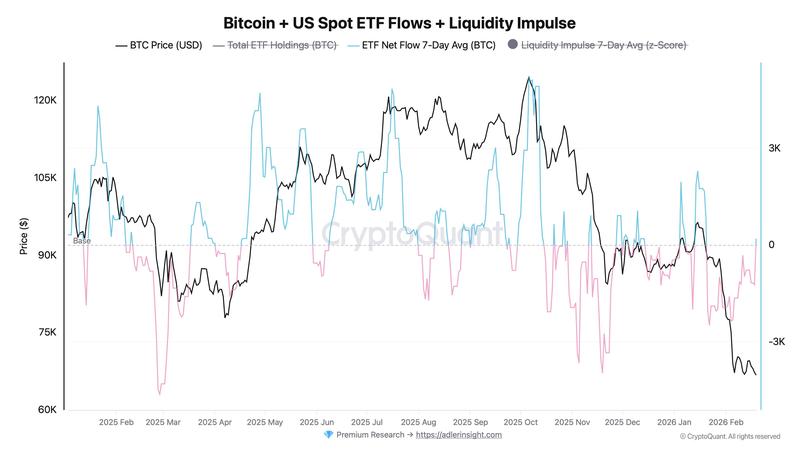
Exchange-traded funds tracking spot Bitcoin (BTC) are headed toward their fourth straight month of negative net flows, coinciding with Bitcoin's approach to a fifth consecutive monthly decline in February. This deceleration is evident through declining fund balances and pessimistic rolling net flow metrics, particularly when compared to ETFs tracking alternative assets.
As both Bitcoin's price and spot ETF holdings have trended downward since October, market participants are seeking clarity on what lies ahead for BTC's future trajectory.
Bitcoin ETFs capture market attention
The net assets under management in US spot Bitcoin ETFs reached their zenith near $170 billion during October 2025 but have since contracted to $84.3 billion. Cumulative net inflows have retreated to approximately $54 billion from the all-time peak of $63 billion. From July 2025 onward, cumulative net flows have amounted to a mere $5 billion, highlighting the dramatic decline in capital influx.
Bitcoin analyst Axel Adler Jr. monitored seven trading sessions spanning Feb. 12 through Feb. 19 and discovered that net ETF outflows reached 11,042 BTC. The most substantial single-session drawdown occurred on Feb. 12, when 6,120 BTC departed the funds, representing approximately $416 million in value. The trading sessions on Feb. 17 and Feb. 18 witnessed consecutive outflows of 1,520 and 1,980 BTC, respectively. Just two sessions recorded positive flows, with the Feb. 6 session contributing 5,900 BTC to the funds.
According to Adler, confirmation of renewed accumulation in the ETFs requires three consecutive sessions showing positive flows. In the absence of such a trend, the outflows persist as a supply source pressuring the marketplace.
The broader macroeconomic indicators corroborate the cooling pattern. The ETFs have experienced a reduction of approximately 87,000 BTC since November 2025, with around 15,000 BTC departing in February alone. Current total ETF balances stand at approximately 1.26 million BTC, representing a decrease from the 1.36 million BTC high-water mark.
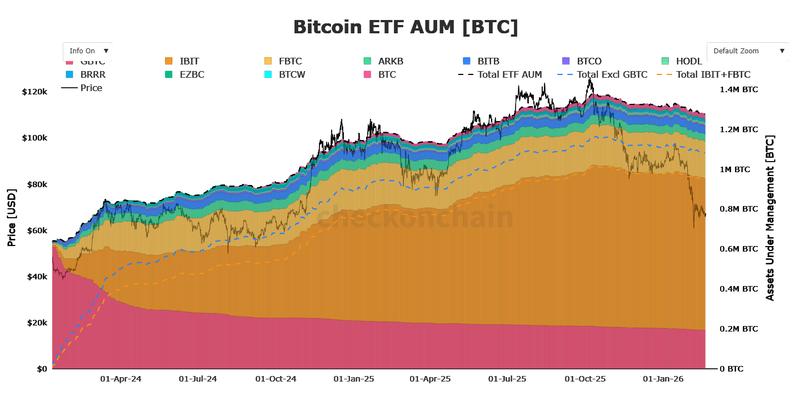
The divestment from the largest BTC funds has been quantifiable. BlackRock's IBIT position contracted to 759,000 BTC from 806,000 BTC, marking a 6% reduction. Meanwhile, Fidelity's FBTC fell to 186,000 BTC from 213,000 BTC, representing a 12.6% decrease.
Bitcoin's price has experienced a substantially steeper decline compared to the ETF balance reductions, as spot market demand has proven inadequate to completely offset the wider market pressures.
Gold captures momentum away from BTC ETFs
Throughout the preceding two years, Bitcoin and gold ETFs have alternated dominance when examining 90-day rolling flow metrics. The Bitcoin 90-day inflows achieved their apex near $16 billion during March 2024, moderated to $3 to $4 billion from June through October, before jumping to $21.6 billion in December 2024.
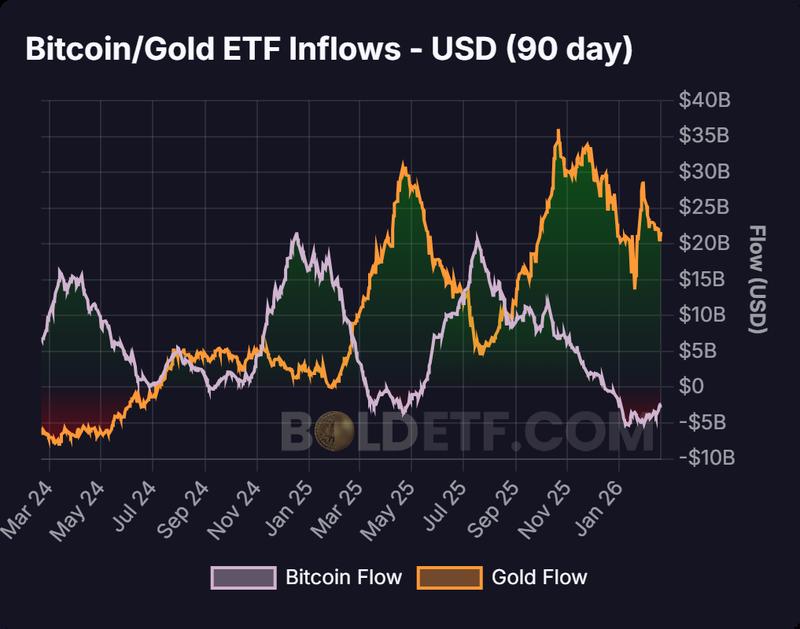
The gold ETFs followed an alternative trajectory. Their flows remained in negative territory until July 2024, subsequently accelerating to $30 billion by April 2025. Throughout March and April 2025, the Bitcoin 90-day flows descended to negative $2 billion.
Gold reached another peak at $36 billion during October 2025, as Bitcoin inflows diminished through the final quarter. By January 2026, gold flows had climbed to $29 billion before moderating to $21 billion by mid-February while Bitcoin flows continued languishing in negative territory.
The metrics reveal a recurring rotation between these two assets. Periods characterized by weakening Bitcoin ETF demand corresponded with surges in gold inflows, most notably from March through October 2025.
When viewed comparatively, gold ETFs attracted incremental capital as market participants gravitated toward the asset featuring reduced price volatility and an established historical record during risk-averse market phases.
Bitcoin demand experiences "restrictive digestion" pressures
ITC Crypto founder Benjamin Cowen characterizes the opening quarter of 2026 as a "late-cycle restrictive digestion" period for both equities and cryptocurrency markets.
The US Federal Reserve concluded quantitative tightening during December 2025, stopping the balance sheet reduction, yet monetary policy continues to maintain restrictive characteristics relative to market growth projections. The federal funds rate remains elevated above the 2-year Treasury yield, as the 10-year yield hovers near 4.1% and the 10-year real yield maintains levels around 1.7%–1.8%, sustaining tight financial conditions.
The presence of positive real yields enables investors to generate inflation-adjusted returns within fixed income markets, thereby elevating the opportunity cost associated with holding non-yielding assets like Bitcoin.
Cowen observed that during previous tightening cycles, Bitcoin's price deteriorated before equities exhibited distress signals. During 2019, BTC price peaked and declined several months prior to broader weakness manifesting in equity markets.
Historical patterns indicate that sustained ETF inflows have typically materialized following declining real yields or the implementation of a definitive easing cycle. Neither of these conditions has emerged to date, potentially accounting for the demand slowdown affecting Bitcoin ETFs since October 2025.