Bitcoin Bulls Face Critical Decision: Acquire at $72K or Exit Positions?
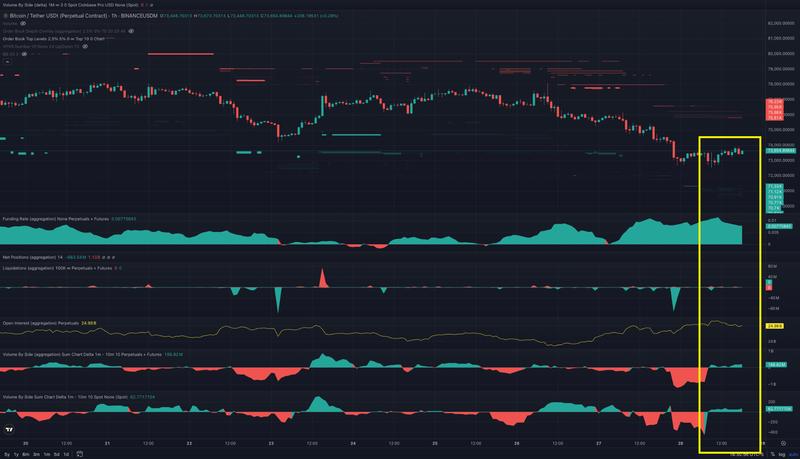
Market participants offloading positions across spot, futures and ETF venues have driven Bitcoin toward its monthly range floor near $72,000, though emerging data indicates retail investors are accumulating the dip and initiating long positions.

After Bitcoin (BTC) successfully broke free from its channel formation and achieved a sustained multi-day settlement above the $77,000 resistance threshold, market participants celebrated and proclaimed the bearish phase had concluded.
Jump ahead to today's market conditions and BTC has breached several critical support thresholds and now looks vulnerable to potentially retesting $70,000, representing a 16% drawdown from its range peak levels.
Although multi-billion-dollar spot BTC ETF withdrawals, renewed military conflict between the US and Iran, anxieties regarding accelerating inflation and mounting doubts that the CLARITY Act will secure Senate approval all contribute to Bitcoin's deteriorating momentum, the critical question centers on whether spot and futures buying pressure will materialize and halt the price deterioration.
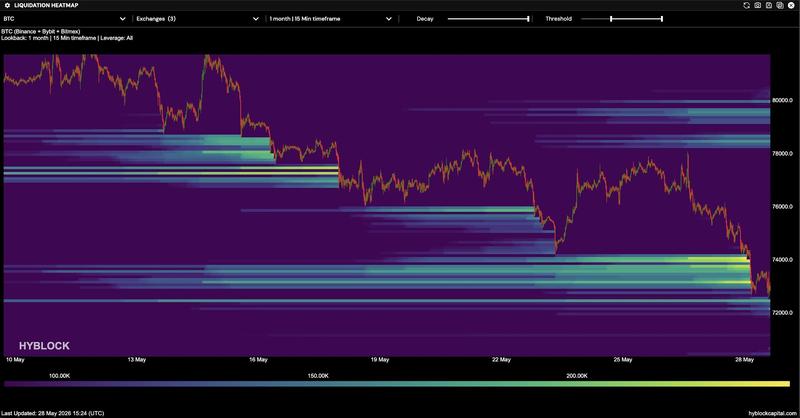
Following the drop beneath $75,000 in February 2026, this price point has functioned as a crucial support/resistance threshold. With $60,000 recognized by market analysts as the cycle floor for BTC, extended-term leveraged positions were established around the $70,000 to $75,000 range, and a substantial portion of these positions are being eliminated this week.
Liquidation heatmap data from Hyblock highlighted this dynamic, and in a post on X, the analysts said, "On the higher lookback (1 month of liquidity), we continue stairwelling down, taking another large long liq cluster."
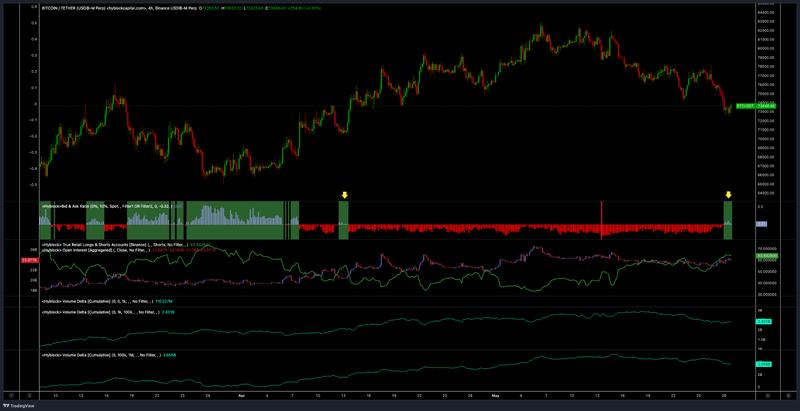
Although returning to the lower boundaries of Bitcoin's 2026 trading range represents less than optimal conditions for bullish investors, a positive development has surfaced. When BTC declined below $73,000 on Thursday, the BTC/USDT bid-ask ratio indicator at Hyblock registered candles exceeding zero, marking the first occurrence since April 12.
Configured to 10% order-book depth, the bid-ask ratio measuring 0.03 demonstrates bids achieving dominance in order books as BTC price descended below $73,000, providing an early signal that market participants are accumulating in spot marketplaces.
Simultaneously, the true retail longs-and-shorts accounts indicator, which displays the proportion of retail futures accounts maintaining long positions, has climbed above 64%.
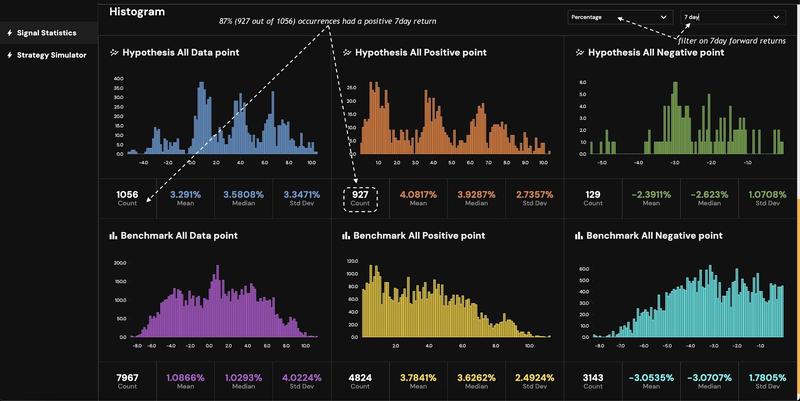
According to Hyblock analysts,
"If you long every single 15m candle that had true retail accounts long percentage above 64% (the current value), then 927 out of 1,056 (88%) of those candles results in positive 7d forward returns."
The analytics indicate that notwithstanding the pessimistic sentiment pervading negative news developments, the spot ETF market dynamics and unstable geopolitical conditions, the retail investor segments within spot markets perceive the current valuation as attractively discounted.
An identical perspective is reflected by the spot and futures aggregate cumulative volume analytics at Binance where "dip buyers" are observed producing $185.58 million and $62.8 million in trading volume throughout the previous 10 hours.