
Analyst: Critical $74K Level Will Determine Bitcoin's Next Trend Direction
The $74,000-$75,000 price zone has become a focal point for BTC investors as exchange deposits increase and bullish indicators fade after Bitcoin couldn't sustain levels above $82,000.

Over the weekend, Bitcoin (BTC) failed to maintain its position above the $80,000 threshold, and market data indicates that the digital asset must remain above the $74,000-$75,000 zone, which has consistently functioned as critical support throughout the past two years.
According to crypto analyst Ardi, the upcoming test of the $74,000-$75,000 price zone may represent the most significant support challenge during this bear market cycle.
Ardi highlighted the significance this price zone has demonstrated over the previous two years. Throughout 2024, Bitcoin experienced difficulty surpassing this range during a consolidation period that extended seven months. During the first quarter of 2025, this identical zone functioned as support before BTC surged to reach its cycle peak at $126,000.
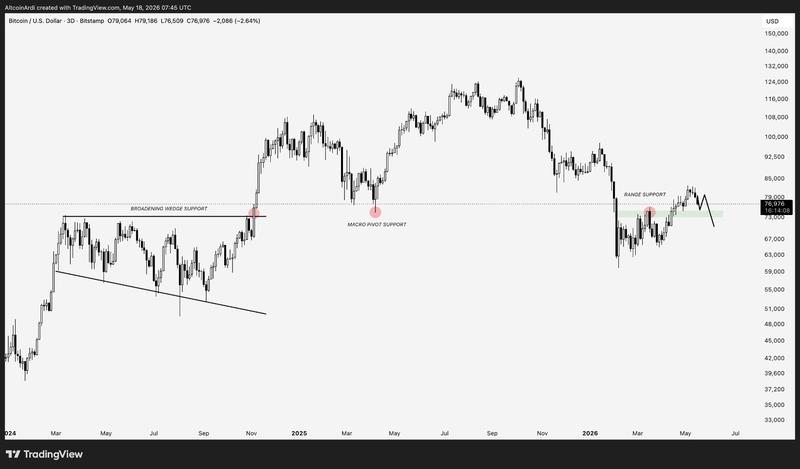
Following a weekly decline of 5.78% that brought Bitcoin down to $77,900, the cryptocurrency is now nearing this critical level. According to Ardi, this zone holds particular significance due to numerous major price pivots that developed at $74,000-$75,000 throughout various time frames.
Crypto trader Alex Wacy highlighted the importance of the $70,000 threshold. According to Wacy, successfully maintaining that price point could facilitate a rally back to the $85,000-$90,000 range. However, a breakdown below this level might trigger a more substantial correction toward the $50,000-$60,000 zone.
Bitcoin market signal weakens again
According to Bitcoin researcher Axel Adler Jr., the Bitcoin bull-bear structure index has reverted to bearish territory following BTC's inability to maintain levels above $82,000 during the early part of this month.
This index monitors six different indicators associated with exchange-traded fund (ETF) demand, trader activity, exchange flows, and short-term price momentum. When the reading is positive, it suggests buyers have market control, whereas a negative reading signals increasing seller pressure.
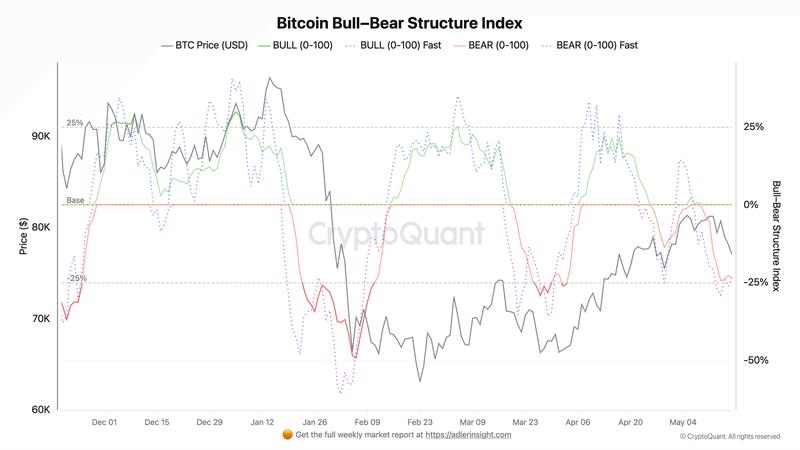
The positive signal persisted for fewer than three trading days. The index temporarily turned positive on May 6 as Bitcoin approached $82,000. However, by May 17, the metric had fallen to -23.49, demonstrating that sellers had swiftly regained market control.
At the same time, data from CryptoQuant revealed increased Bitcoin transfers to exchanges from investors who purchased BTC six to 12 months ago. These investors acquired Bitcoin at an average price of approximately $110,851, which means many are currently experiencing substantial unrealized losses following the recent price decline.
The percentage of older coins being transferred to exchanges also jumped to 10.54%, significantly higher than its typical level of less than 1%, with market analyst Easy On Chain stating,
Historically, this reflects investors locking in major losses and exiting the market, creating severe spot-market selling pressure.