ETH taker volume surges 72% as market eyes $2.6K liquidity zone
Strong buyer dominance in ETH derivatives markets positions traders to focus on the $2,500-$2,600 range as a critical target for the upcoming rally.

Ether (ETH) futures trading on Binance has climbed to levels not witnessed in nearly two months as determined buyers have entered the market throughout the previous week. The buy-taker volume has surged past the $5 billion threshold, with current market conditions indicating that the ETH price rally shows strong potential for continuation.
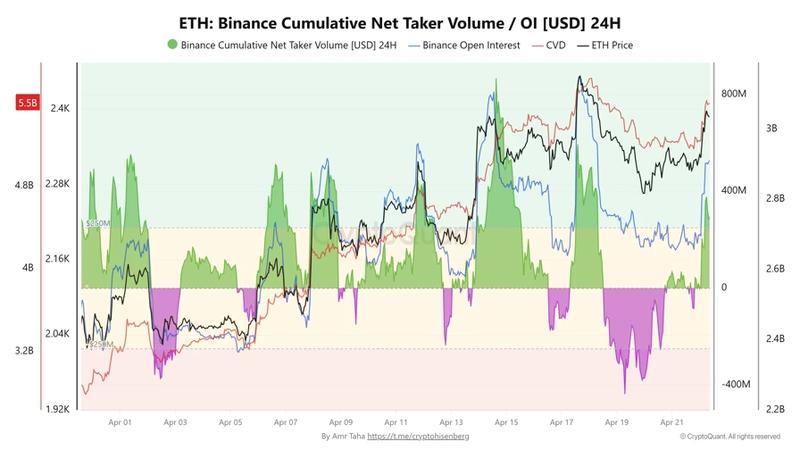
The 24-hour cumulative net taker volume on Binance reached $5.5 billion, marking a 72% increase from the earlier monthly figure of $3.2 billion. This particular metric measures the gap between market buy orders and sell orders, providing insight into which side is controlling the price movement.
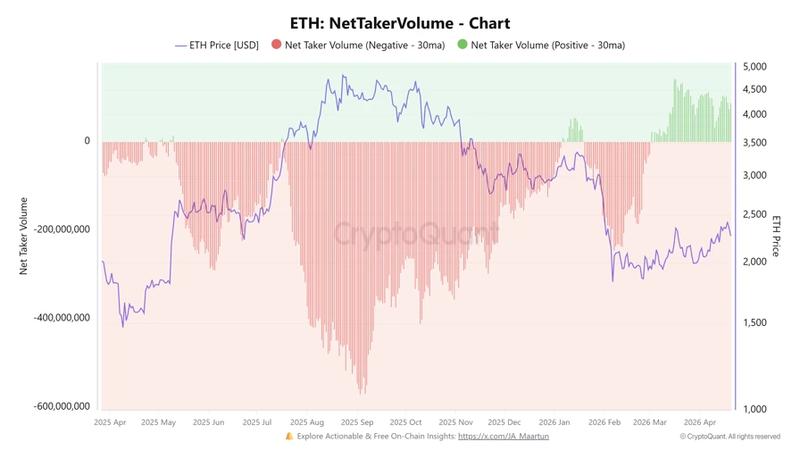
Since March 1, the 30-day average has maintained positive territory, reaching levels that haven't been observed since July 2022. These positive measurements demonstrate persistent aggression from buyers in the market.
According to crypto analyst Amr Taha, buying spikes occurring near local highs serve as signals of enhanced conviction among market participants. This type of sustained demand frequently allows buyers to maintain control over the price direction in the short term.
Ether's $2,400 resistance hits a liquidity gap
Currently, the ETH price is consolidating beneath the $2,400 threshold, which represents a resistance point that has faced three separate tests since Feb. 6. With each rejection, the concentration of sell orders positioned above has diminished. A decisive breakthrough above this price point would expose the range spanning $2,475 to $2,634, which contains a daily fair-value gap.
This gap was created during the February sell-off and represents a region where the price advanced rapidly, resulting in unfilled orders. As momentum continues to build, ETH's price could return to these areas to rebalance trading flows.
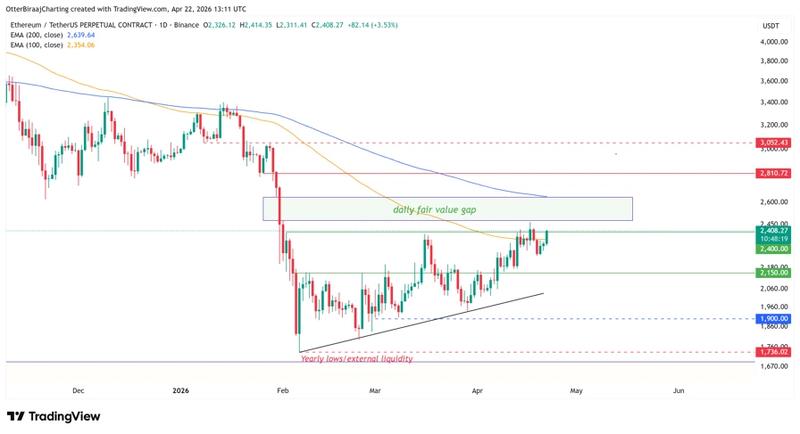
Additionally, Ether is making an attempt to recover the 100-day exponential moving average (EMA), which is a price level typically linked with trend-continuation patterns. Maintaining stability above this trending indicator would strengthen the bullish rally. The 200-day EMA is gradually moving toward the upper boundary of the imbalance zone close to $2,634, forming a technical convergence point with liquidity.
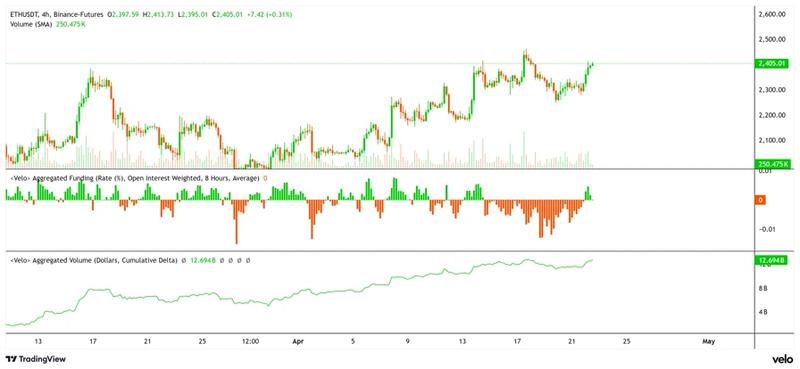
The positioning within derivatives markets provides additional perspective. The cumulative volume delta (CVD) for futures continues its ascent toward $12.6 billion, whereas funding rates are holding near neutral territory.
This suggests that leverage has not expanded in an aggressive manner alongside the price increase. The equilibrium between buyer demand and controlled leverage maintains focus on the $2,475 to $2,634 zone as a short-term liquidity concentration area.