Fractal analysis warns of potential 40% TAO price decline in coming weeks
Despite surging 160% over the past month, Bittensor's TAO is displaying a recognizable golden cross formation that historically signaled significant downward corrections.

Bittensor (TAO) has experienced a remarkable 160% surge recently, but technical indicators suggest the rally may be running out of steam as the cryptocurrency displays a golden-cross chart pattern that has historically been followed by significant price declines.
Key takeaways:
- TAO displays a golden cross formation that has historically preceded an average price decline of 40%.
- Discussion volume surrounding Bittensor has increased substantially, yet retail investor excitement appears restrained.
Bittensor faces potential 40% price correction within weeks
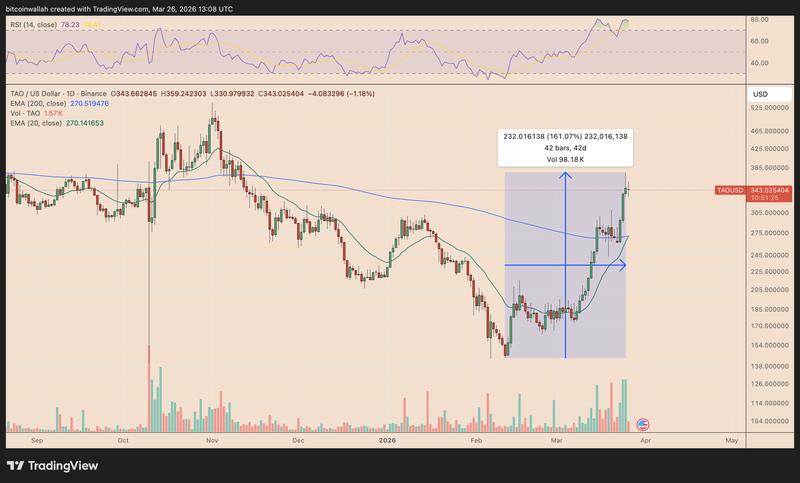
On Thursday, March 26, TAO's 20-day exponential moving average (20-day EMA, represented by the green line) crossed above its 200-day exponential moving average (200-day EMA, shown as the blue wave).
Market participants generally interpret a shorter-term moving average crossing above a longer-term moving average as a positive indicator. However, for TAO, this technical formation has frequently emerged near local price peaks, occasionally leading to brief additional gains before experiencing sharp reversals.
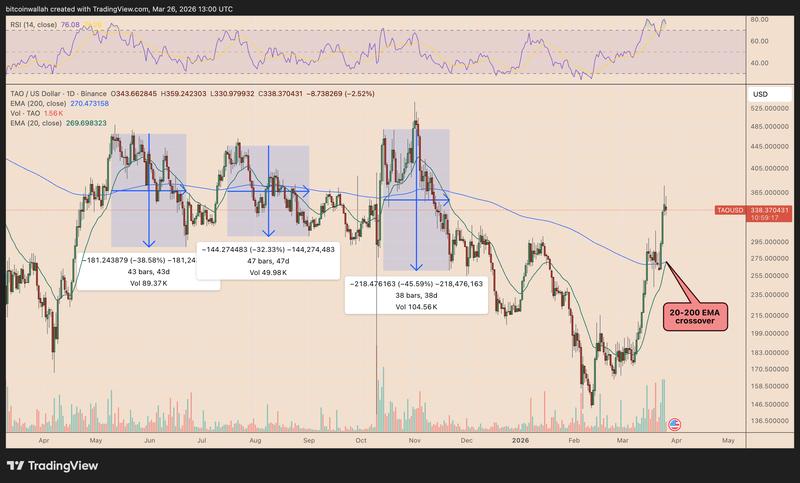
During the previous three instances of comparable crossover patterns, TAO experienced declines of approximately 38.50%, 32.50%, and 45.50% over a five-to-six-week period. This represents an average price decline of roughly 40%, increasing the probability that Bittensor could retreat to the $200 level by the beginning of May should this historical pattern play out once more.
The potential for downside movement in TAO is further amplified by its relative strength index (RSI), which has remained elevated above the 70 overbought level for several weeks. This indicator reading implies that the recent price surge may have advanced excessively and rapidly, elevating the likelihood of traders locking in profits or a temporary pullback occurring.
The wider macroeconomic environment contributes additional bearish factors, as the intensifying US–Iran war drives oil prices higher, increases inflation concerns, and diminishes expectations for imminent Federal Reserve rate cuts.
Retail euphoria remains absent despite TAO's impressive gains
While TAO's price advance has generated a substantial spike in online conversations, it has not been accompanied by the type of exuberant sentiment that usually characterizes local price peaks, based on information from data analytics provider Santiment.
The social volume metric tracking activity across X, Reddit, Telegram, and various other platforms has risen to its second-highest reading over the past six months, exceeded only by the intense discussion surrounding TAO's $529 price peak recorded in November.
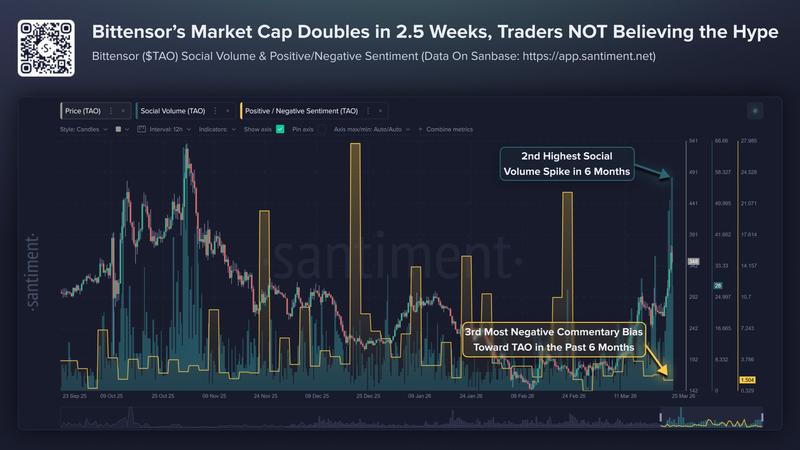
Simultaneously, the sentiment surrounding the cryptocurrency remains comparatively restrained, with the ratio standing at just 1.5 positive remarks for each negative comment.
This is generally a good sign that the rally can continue, with little interference from greedy traders that typically signal forming tops.
Santiment
Nevertheless, the golden cross fractal pattern observed in TAO suggests that even price rallies supported by strengthening sentiment have the potential to transform into bull traps.
In the previous three occasions featuring similar golden-cross configurations, TAO continued to advance by approximately 15.6%, 5.7%, and 42.6% respectively before ultimately reversing direction and moving lower.
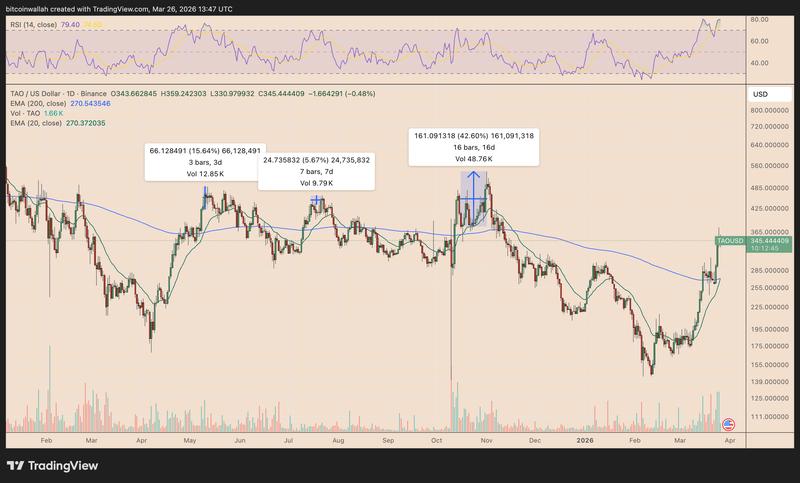
This historical performance indicates an average post-crossover gain of approximately 21.30%, suggesting the possibility of a near-term Bittensor price advance toward the $420 level or beyond before the upward momentum becomes exhausted.