Five Critical Bitcoin Developments This Week: BTC RSI Signals Major 2026 Pattern
An "intriguing" RSI divergence materialized for Bitcoin heading into the Q2 and June candle close, with market analysis drawing parallels between the current $60,000 level and the $30,000 threshold during the 2022 bear market.
As Bitcoin (BTC) approaches the conclusion of June and Q2 2026, the cryptocurrency threatens to surrender $60,000 support — will RSI divergences provide salvation for bullish traders?
Key points:
- Critical bullish divergences are appearing in Bitcoin RSI data that were not present during earlier 2026 price drops.
- Market participants express anxiety about potential support breakdown as comparisons to the 2022 bear market emerge.
- Macroeconomic developments depend on labor market indicators and the Iran peace agreement, with potential positive catalysts for cryptocurrency markets.
- Historical patterns suggest July tends to deliver for Bitcoin bulls when June disappoints.
- Analysis of onchain metrics reveals Bitcoin's "first bottoming flag" is now visible.
2026 bear market features notable Bitcoin RSI divergence
A traditional BTC price anticipatory metric continues to enhance the probability of an upward reversal as the month of June draws to a close, according to TradingView data.
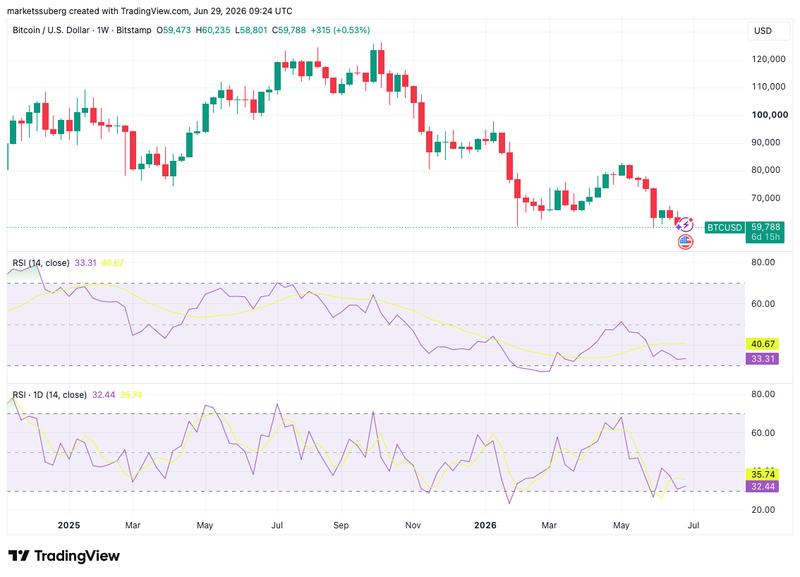
According to Cointelegraph's previous coverage, relative strength index (RSI) signals spanning multiple timeframes are establishing bullish divergences relative to price movement.
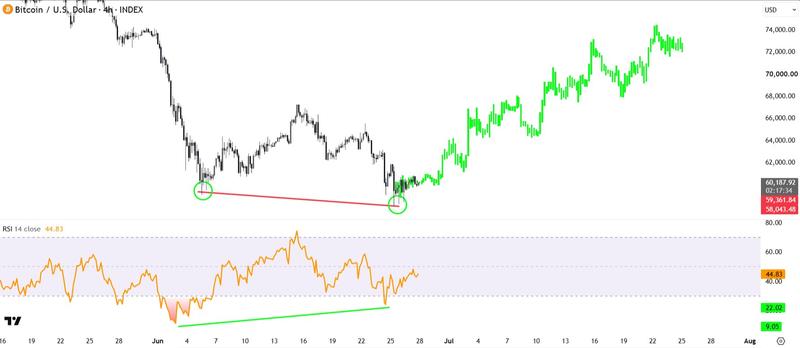
"$BTC is printing a bullish RSI divergence while a potential double bottom forms," stated Bitcoin whale Gerla, who manages the Gerla trading group, in a message to X followers regarding the four-hour chart this past Sunday.
"This is getting interesting."
Growing anticipation is spreading throughout the trading community, with pseudonymous market commentator and trader Heisenberg identifying an important distinction between Bitcoin's most recent macro lows and earlier declines throughout 2026.
"Small sample size but still noteworthy. Notice the last two oversold RSI divergences (in orange) formed bottoms," they posted alongside their chart on X.
"The last two recent drops (in blue) had no RSI divergences... UNTIL NOW... Is this the one?"
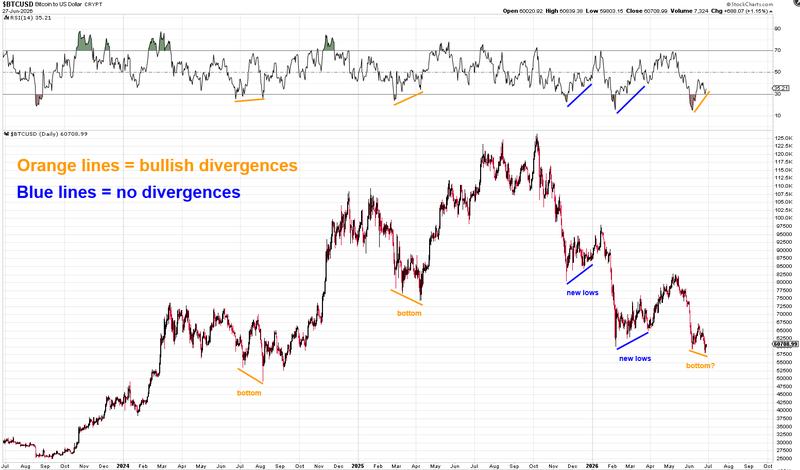
Some of Bitcoin's most substantial trend reversals throughout its history have been preceded by RSI divergences, including the termination of its last bear market during late 2022.
The $60,000 level triggers comparisons to mid-2022
Bitcoin experienced moderate gains at the start of the week following a weekly close beneath $59,500 — marking its first time below this threshold since September 2024. The $60,000 level is increasingly functioning as resistance, with bullish forces failing to generate substantial momentum.
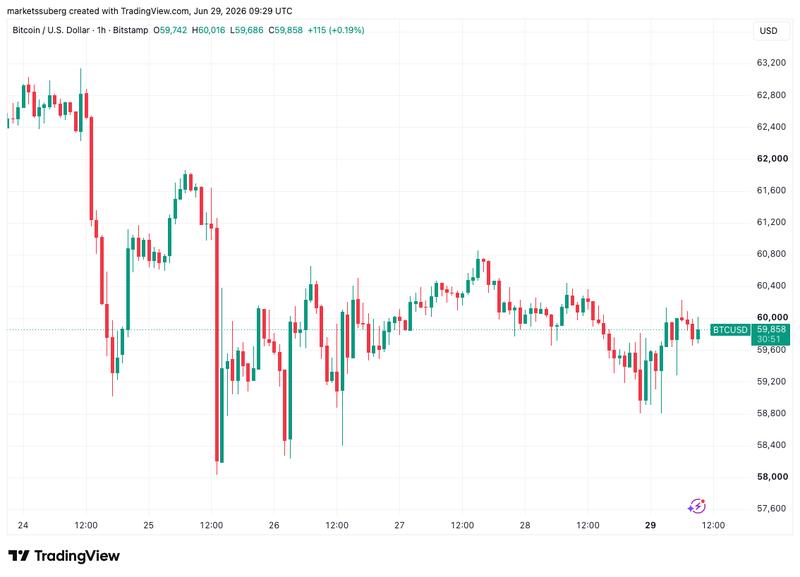
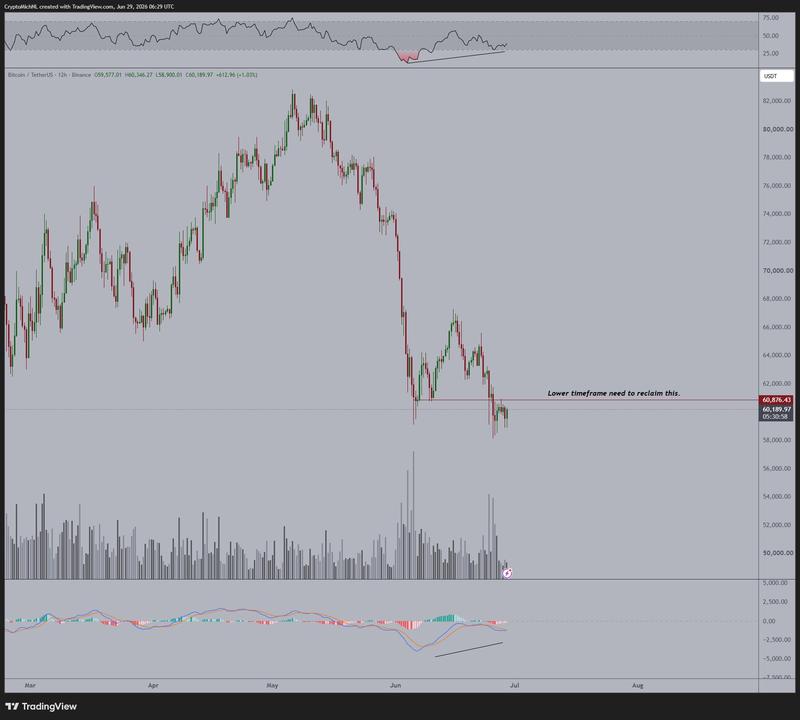
"Quite funny enough, this is not a bad start of the week for Bitcoin as it bounces upwards," commented crypto trader and analyst Michaël van de Poppe in his most recent X analysis.
"We need to see way more momentum, and a clear break above $61,000, however, the bullish divergence is there and shouldn't be ignored."
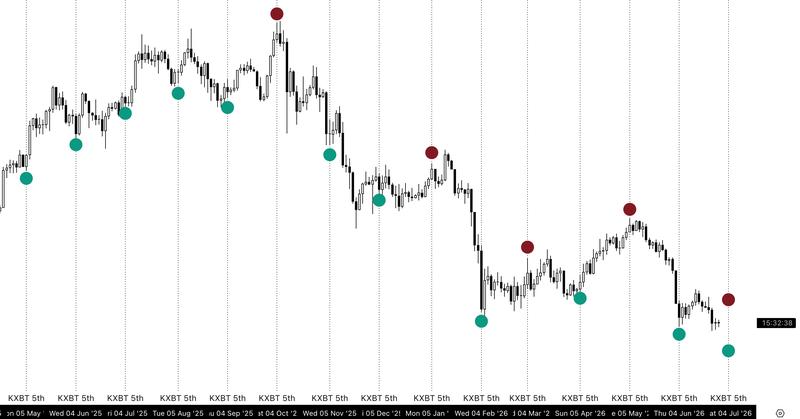
As the monthly and quarterly closes draw near, trader Killa proposed that the forthcoming BTC price movement would hold special importance within the broader long-term trend.
"A few more days and $BTC reaches my 5th pivot. For the past 18+ months, we've consistently seen major directional shifts around this point at the start of each month," they outlined on Monday.
"Whether it's a pivot low or a pivot high, this is a key time to start paying close attention."
Information from tracking resource CoinGlass indicates June losses for BTC/USD approaching 19% — representing the worst monthly decline since the 2022 bear market and the steepest decline of the current year.
Regarding the future of $60,000 support, market commentator Exitpump maintained that a patient approach was necessary.
"Significant support and resistance levels rarely break on the first attempt. They usually require a lot of time, effort, and repeated tests before finally giving way," they posted over the weekend.
"60K now reminds me of 30K in 2022."
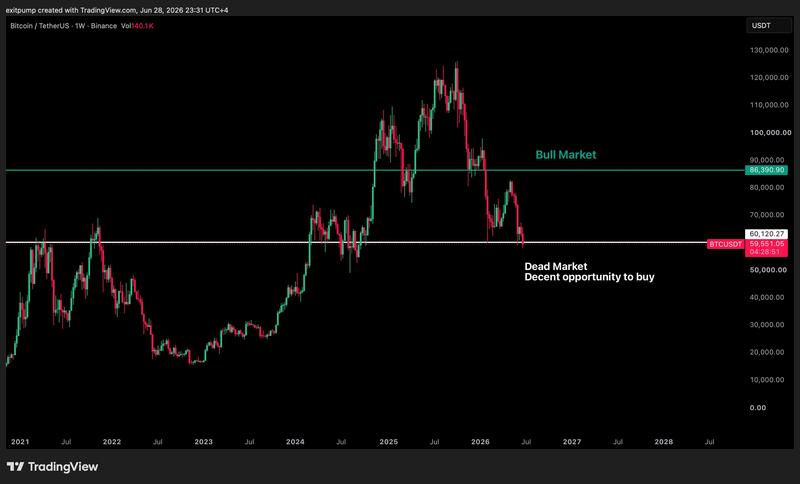
The cryptocurrency spent multiple months engaging with the $30,000 price level in mid-2022 before ultimately surrendering it as support, establishing its bear-market bottom approximately five months afterward.
Looking toward higher prices, Exitpump anticipated that a "full blown bull market will be back" following the return of $86,000.
PMI report emerges as crypto focal point among week's macro releases
A diverse array of US macroeconomic data creates a "short but busy" four-day trading week as Q2 concludes.
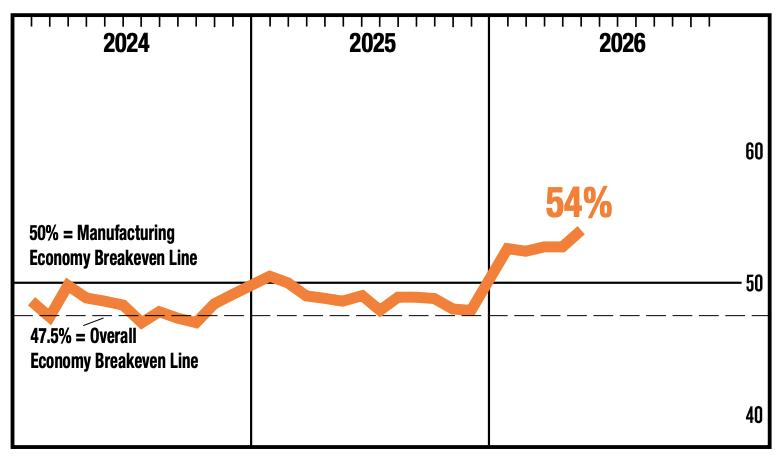
Wednesday will deliver the latest Manufacturing Purchasing Managers Index (PMI) report from the Institute of Supply Management (ISM) — representing a possible positive catalyst for cryptocurrency markets.
The indicator continues its emergence from a multiyear downward trend, and forecasts anticipate continued bullish data with a reading around 54, though potentially showing a modest decline from the previous month.
Another area of concentration involves the labor market as markets digest various employment statistics, including the June nonfarm payrolls report scheduled for Thursday.
"We have a short but busy week ahead," summarized trading resource The Kobeissi Letter in an X thread.
Kobeissi observed that the week would commence with responses to geopolitical events as the US and Iran agree to engage in discussions regarding their delicate peace agreement.
"This week also marks the end of Q2 2026 with earnings season on the horizon," the account noted.
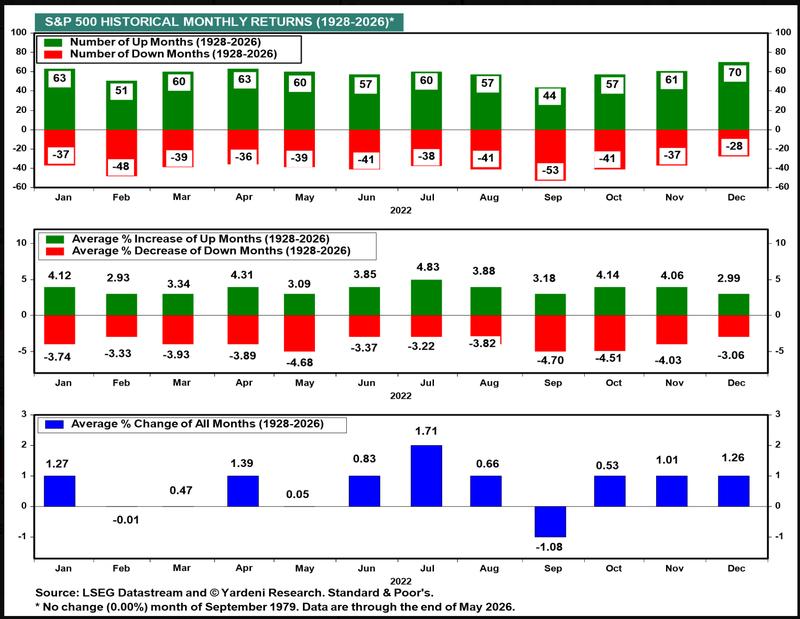
"The S&P 500 is about to enter one of the best months of the year for calendar seasonality," the analysis continued.
"While weakness in the back half of June is common, July ranks as the best performing month based on data going back nearly 100 years."
The correlation between Bitcoin and equities has demonstrated inconsistent behavior during recent months, with crypto-industry analysts themselves characterizing the BTC-tech stock connection as "overblown."
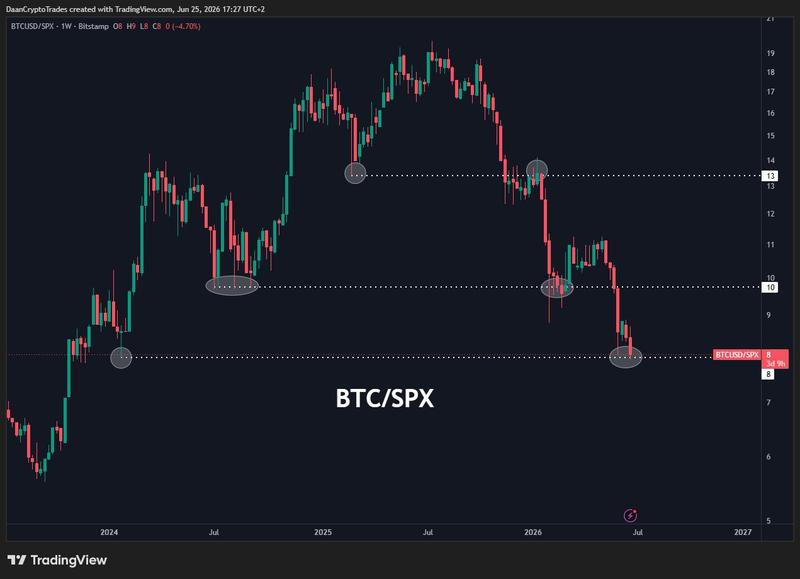
"$BTC vs S&P 500 back at the level it held during the Yen Carry trade blowup and the initial June low," noted trader Daan Crypto Trades this past weekend, referencing BTC price negative catalysts throughout the previous year.
"If you believe in people trading relative values or ratios on different assets, then you will see that this is an important level to hold for $BTC relative to stocks. Because down here there is not much support left until you're at the late 2023 pre spot ETF rally levels."
July BTC price recovery anticipated by analysis
While a mirror movement by Bitcoin following an equities recovery remains far from certain, historical data supports a return to bullish momentum as July commences.
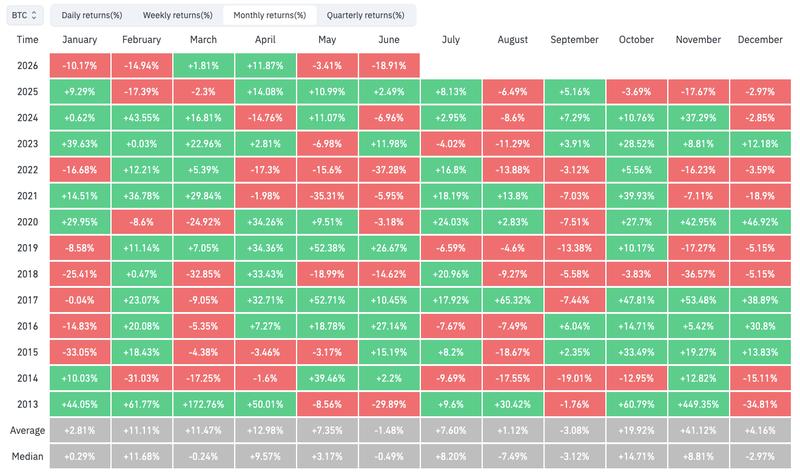
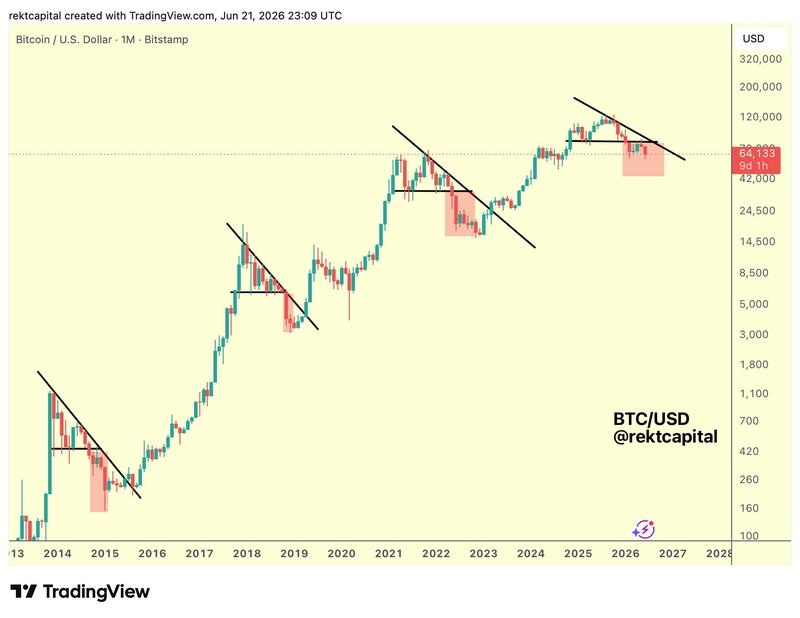
New research from trader and analyst Rekt Capital demonstrates that during past years, July price action typically provides a contrast to June's performance.
"If history repeats for Bitcoin, then the pattern may be as follows for next couple of months: June ends as a red month, July could be green in response, And August could therefore be red to cancel out July's upside completely," he communicated to X followers during the previous week.
CoinGlass data validates the contrast between June and July performance, with merely three exceptions recorded since 2013. Among these outliers is 2025, when BTC/USD concluded both months with gains.
Through the current year, the trading pair is down 18.4% during June, marking its poorest showing since the 2022 bear market.
According to Cointelegraph's reporting, Rekt Capital maintains that the current bear trend still possesses months of duration remaining, with new lows potentially emerging before a long-term bottom materializes. A chart shared on X positioned the bear market at 71% completion as of June 22.
Bitcoin indicator generates "first bottoming flag"
Perspectives continue to vary regarding whether Bitcoin has already established its bear-market floor.
According to ongoing Cointelegraph coverage, market participants generally concur that additional development is necessary before a persuasive downtrend reversal materializes.
Within its most recent analysis, onchain analytics platform CryptoQuant contributes to that consensus — while offering an early encouraging signal for Bitcoin bulls.
"Bitcoin is starting to show the first clear sign of a deeper market clean-up," stated contributor I. Moreno in a QuickTake blog post published Sunday.
Moreno highlighted a less commonly tracked onchain indicator, the UTXO Block P/L Count Ratio Model. This metric compares the collective profitability of blocks containing unspent transaction outputs, or UTXOs.
"In simple terms, it measures how broad the market's profit base is beneath price. When the ratio is high, most UTXO blocks remain in profit. That usually reflects a market still carrying a large amount of unrealized gains, which also means higher distribution risk," according to the post.
"When the ratio collapses toward the lower range, the opposite happens: profitability compresses, losses become more widespread, and the market starts moving into a more advanced reset phase."
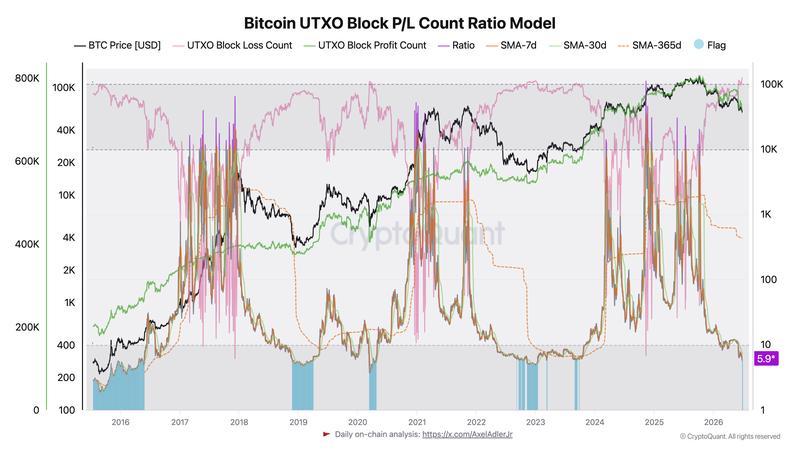
The Ratio presently registers at 5.9, indicating its lowest reading since 2022 and among its lowest measurements historically. Moreno designated it as "Bitcoin's first bottoming flag" within the ongoing bear market.
"The main takeaway is that BTC is finally showing evidence of a meaningful internal clean-up. But if history is a guide, the market may still need to absorb more stress before the bearish phase can fully exhaust itself," he concluded.