Crypto Markets Face Bearish Pressure As Bitcoin And Altcoins Decline Amid Inflation Concerns
Bitcoin fell to the critical $76,000 support zone as major altcoins experienced significant selloffs. Will technical analysis indicate opportunities for traders to enter the market at these lower levels?
Key points:
- Bitcoin has declined to the $76,000 zone, representing an important short-term support area that requires monitoring.
- Multiple prominent altcoins have breached their short-term support zones, signaling that bullish momentum has weakened.
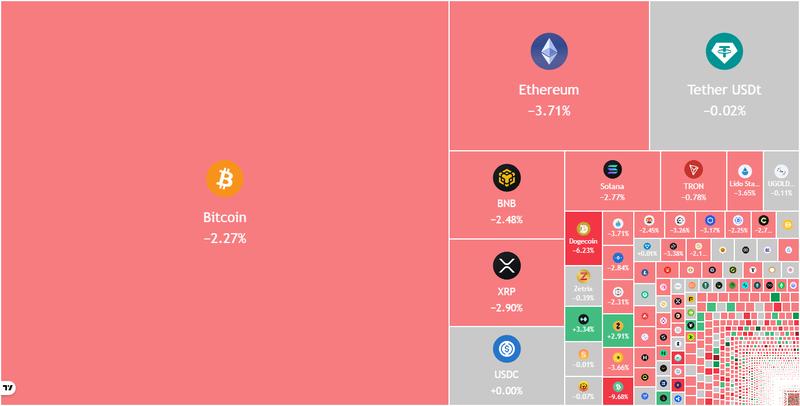
Bitcoin (BTC) experienced selling pressure on Monday following US President Donald Trump's warning to Iran that the "clock is ticking" and they better get moving fast. In a post on X, analyst CryptoRover stated that a potential US military operation against Iran "is extremely dangerous for $BTC."
Short-term caution appears to be growing among institutional investors as well. Data from SoSoValue reveals that spot BTC exchange-traded funds saw $1 billion in weekly net outflows. This represented the first net outflow following six consecutive weeks of inflows that totaled $3.4 billion.
Despite numerous traders expressing caution regarding BTC's near-term outlook, Michael Saylor's Strategy, recognized as the world's largest public Bitcoin holder, maintained its buying activity. According to Monday's 8-K filing with the US Securities and Exchange Commission, Strategy acquired 24,869 Bitcoin for $2.01 billion during the period between May 11 and 17, increasing its total holdings to 843,738 BTC.
Will BTC and major altcoins rebound from their important support zones? Let's examine the charts of the top 10 cryptocurrencies to determine the outlook.
S&P 500 Index price prediction
The S&P 500 Index (SPX) climbed to a fresh all-time high of 7,517 on Thursday, a level where short-term traders secured profits.
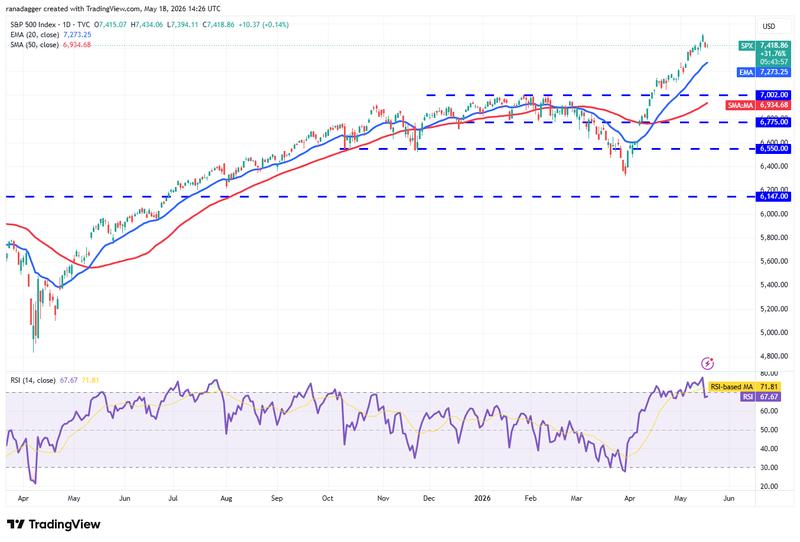
The index could retrace to the 20-day exponential moving average (7,273), an important support zone to monitor. Should the price rebound from the 20-day EMA with conviction, it would suggest positive market sentiment. This would enhance the probability of the uptrend continuing toward the 8,000 zone.
To weaken the bullish momentum, sellers will need to push the price beneath the 20-day EMA. Should they succeed, the index could experience a more substantial pullback toward the 7,002 zone.
US Dollar Index price prediction
The US Dollar Index (DXY) reversed from the 97.74 support zone and climbed above the moving averages.
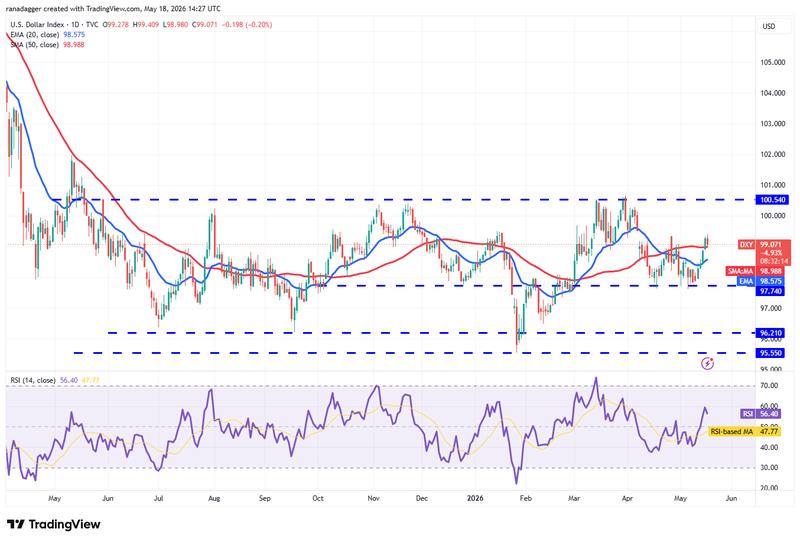
Minor resistance exists at 99.34, but should the bulls maintain the price above this level, the index could advance to the significant overhead resistance at 100.54. Strong defense of the 100.54 level is anticipated from sellers, as a break and close above it would indicate the beginning of a fresh uptrend. Following this, the index could surge toward 101.97.
On the other hand, should the price reverse from the current level or from the 100.54 resistance and fall beneath the 50-day simple moving average (98.98), it would suggest that bears continue to be active at elevated levels. This could maintain the index in a range-bound pattern between 97.74 and 100.54 for several additional days.
Bitcoin price prediction
BTC extended its decline and has arrived at the 50-day SMA ($75,627), indicating that bears are trying to seize control.
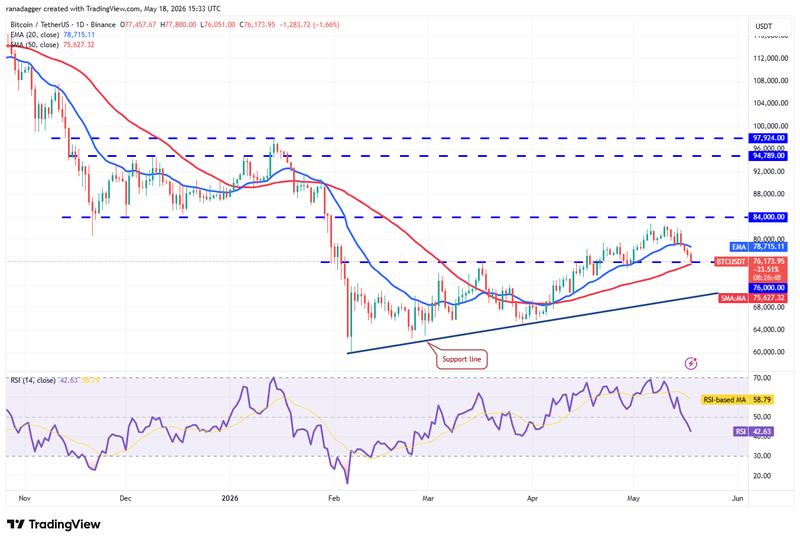
To maintain the advantage, buyers will need to keep the BTC price sustained above the 50-day SMA. The initial indication of strength would be a close above the 20-day EMA ($78,715). This would open the possibility for a rally toward the $84,000 resistance zone.
Alternatively, should the price close beneath the 50-day SMA, it raises the risk of a decline to the support line of the ascending channel pattern. Strong defense of the support line is expected from buyers, as a breakdown below it could send the BTC/USDT pair tumbling to $65,000.
Ether price prediction
Ether (ETH) extended its downward trajectory and settled beneath the support line of the ascending channel pattern on Sunday.
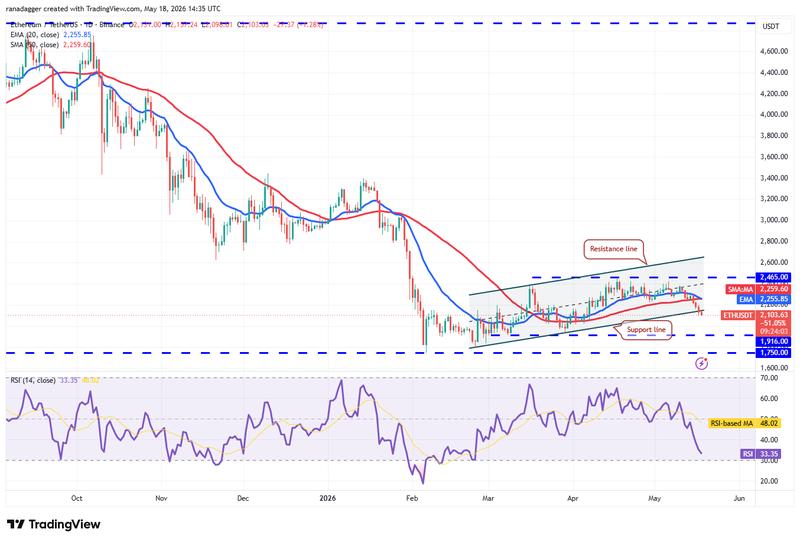
The 20-day EMA ($2,255) has started to slope downward, and the RSI is approaching oversold territory, signaling that bears have seized control. Any bounce attempt is likely to encounter selling pressure at the 20-day EMA. Should the ETH price reverse sharply downward from the 20-day EMA, the probability of a decline to $1,916 rises.
Buyers face a challenging situation ahead. To signal a recovery, they will need to push and sustain the ETH/USDT pair above the moving averages.
XRP price prediction
XRP (XRP) has fallen beneath the 50-day SMA ($1,39), signaling that the bears are trying to establish dominance.
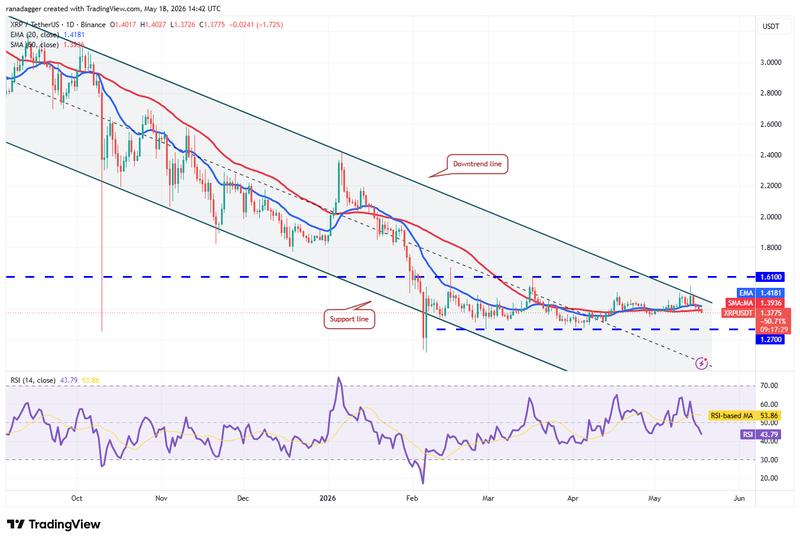
Should the price close beneath the 50-day SMA, the next probable destination is the strong support at $1.27. Vigorous defense of the $1.27 level is anticipated from buyers, as a close below it could push the XRP/USDT pair down to $1.11 and subsequently to the psychological level at $1.
Selling pressure is expected at the downtrend line and then at the $1.61 level for buyers. A break and close above the $1.61 resistance would signal a short-term trend reversal. The XRP price could then advance to $2 and later to $2.40.
BNB price prediction
BNB (BNB) retreated from the $687 overhead resistance and fell beneath the 20-day EMA ($648).
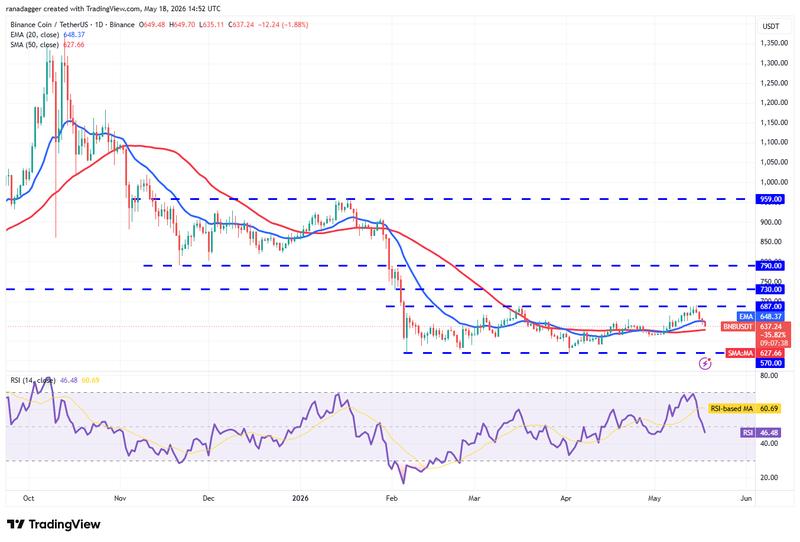
Minor support exists at the 50-day SMA ($637), but should this level fail, the BNB/USDT pair could plunge to the strong support at $570. This represents a critical level to monitor, as a close beneath $570 would indicate the beginning of the next downward leg. The pair could then drop toward $500.
Conversely, should the BNB price reverse upward from the 50-day SMA, it would suggest demand at reduced levels. To indicate strength, buyers will need to drive the price above the $687 resistance. The pair could then climb to $730 and subsequently to $790.
Solana price prediction
Solana (SOL) settled beneath the 50-day SMA ($85) on Sunday, signaling that the bears are staging a comeback.
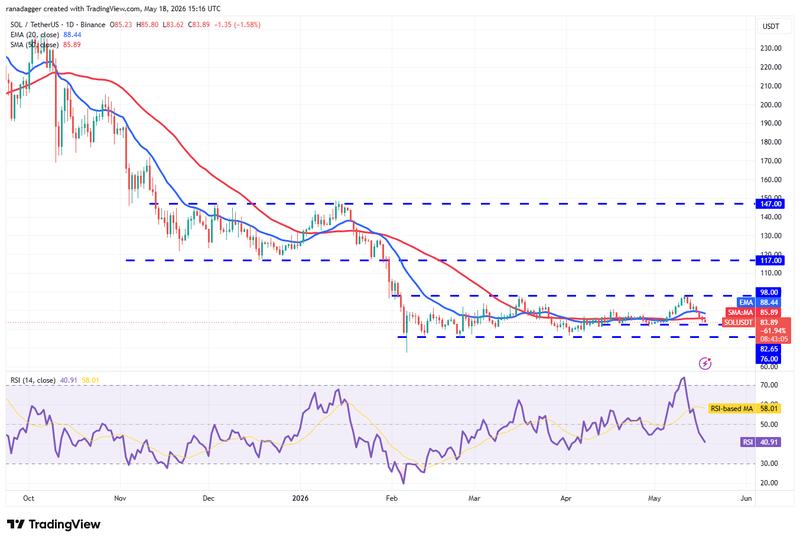
Support exists at $82, but any recovery attempt is likely to encounter selling at the 20-day EMA ($88). Should the SOL price reverse sharply downward from the 20-day EMA, the probability of a breakdown below the $82 support rises. This would open the possibility for a decline to the $76 level.
The initial indication of strength would be a close above the 20-day EMA. This would indicate robust buying at reduced levels. The bulls will regain control after the SOL/USDT pair closes above the $98 resistance.
Dogecoin price prediction
Dogecoin (DOGE) has fallen beneath its 20-day EMA ($0.11), indicating that bulls have surrendered control in the short term.
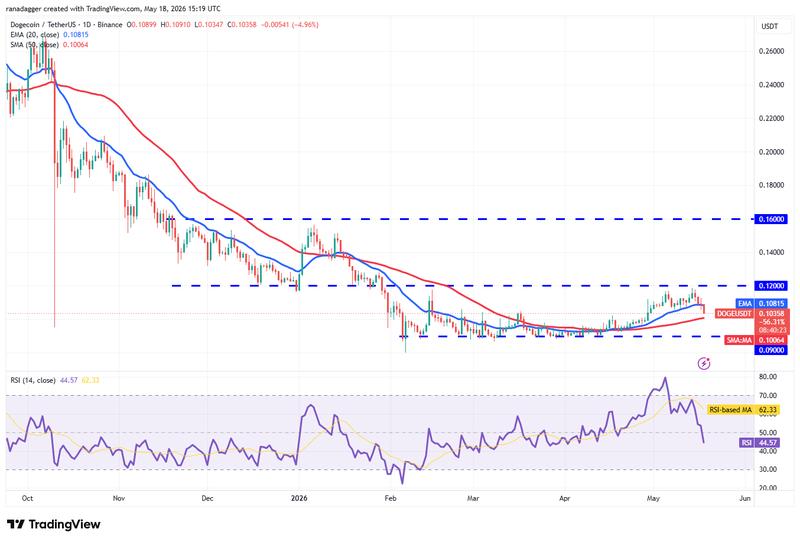
The flat 20-day EMA and the RSI positioned just below the midpoint indicate range-bound activity between $0.09 and $0.12 for some additional time.
To signal the beginning of a fresh upward move, buyers will need to push and maintain the DOGE price above the $0.12 resistance. The DOGE/USDT pair could then rise to $0.14 and later to $0.16.
On the opposite side, a break and close beneath the $0.09 support would indicate the continuation of the downtrend. The pair could then fall to $0.08.
Hyperliquid price prediction
Hyperliquid (HYPE) has experienced volatility over the past few days, signaling an intense battle between the bulls and the bears.
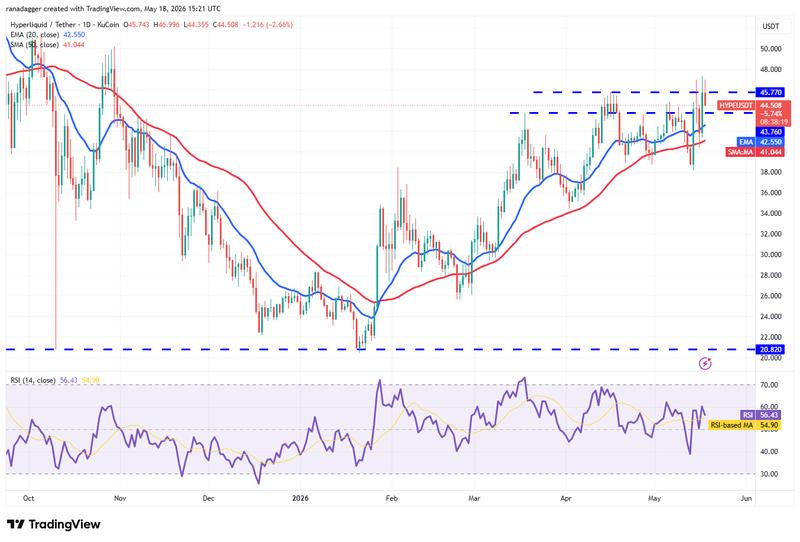
The bulls drove the HYPE price above the $45.77 resistance, but the extended wick on the candlestick indicates selling at elevated levels. To clear the way for a rally to the $50 to $51.43 zone, buyers will need to achieve a close above the $45.77 level.
The 20-day EMA ($42.55) represents the crucial support to monitor on the downside. A breakdown below it would suggest that the HYPE/USDT pair could consolidate within the $38.17 to $47.32 range for some time.
Cardano price prediction
Cardano (ADA) has fallen beneath the 50-day SMA ($0.25), signaling that the bears maintain their pressure.
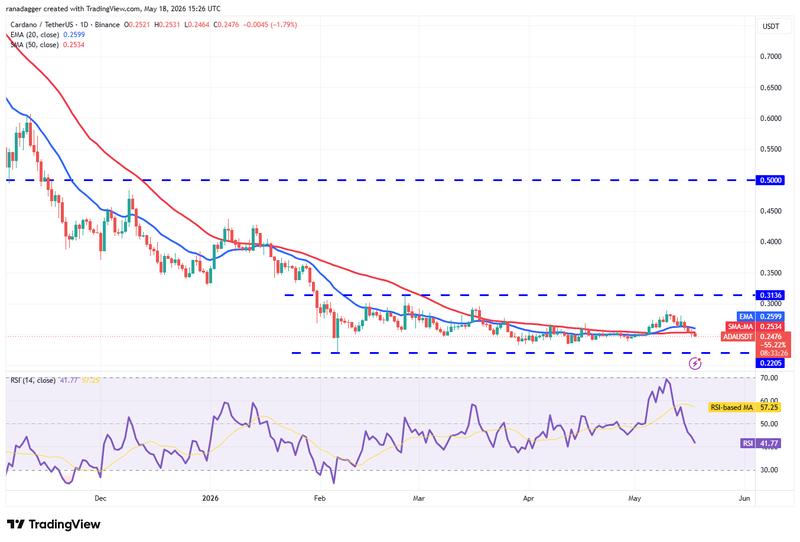
The flat moving averages and the RSI positioned just below the midpoint indicate the ADA/USDT pair could fluctuate within the $0.22 to $0.31 range for several more days.
The next directional move could commence on a close above the $0.31 resistance or beneath the $0.22 support. Should the ADA price reverse upward and break above $0.31, the pair could gain momentum and climb toward $0.40. Conversely, a close beneath $0.22 would signal the continuation of the downtrend toward the target objective of $0.13.