BTC Tumbles to $75K Amid Renewed Hormuz Strait Tensions and Oil Market Concerns
Fresh volatility strikes crypto markets as Bitcoin signals potential turbulence with escalating US-Iran tensions and the shutdown of the critical Strait of Hormuz oil passage.

Bitcoin (BTC) struggled to maintain support at the $75,000 level heading into the Sunday weekly close as cryptocurrency markets navigated renewed instability stemming from the US-Iran conflict.
Key points:
- Bitcoin price action sinks from ten-week highs amid fears that the US-Iran war has returned in full force.
- Iran closes the Strait of Hormuz, bringing back the risk of an oil-price surge.
- BTC price action faces ongoing resistance at a 21-week trend line into the weekly close.
Bitcoin abandons highs as US-Iran war fears return
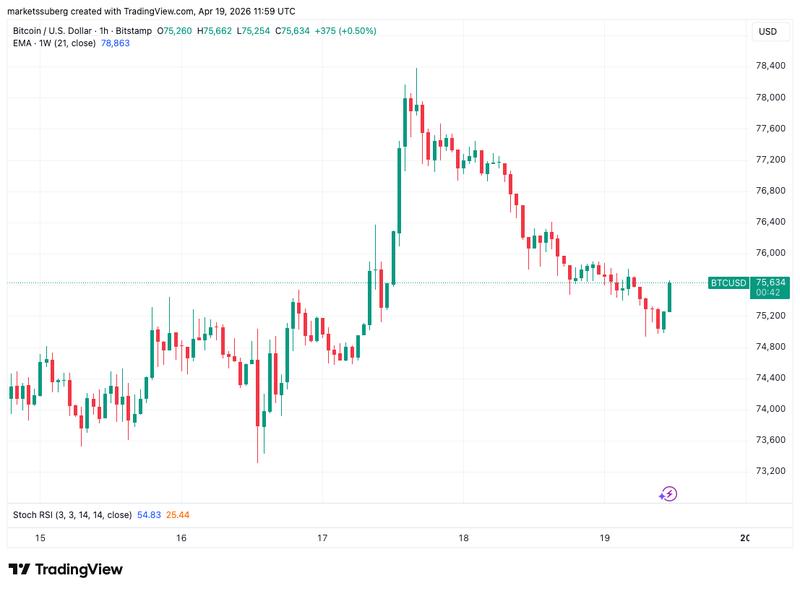
Information from TradingView revealed BTC price pressure making a comeback following a climb to ten-week peaks of $78,400 achieved on Friday.
Conflicting reports emerging from US and Iranian authorities defined the weekend atmosphere, with what appeared to be a ceasefire and bilateral agreements between the nations now looking increasingly uncertain.
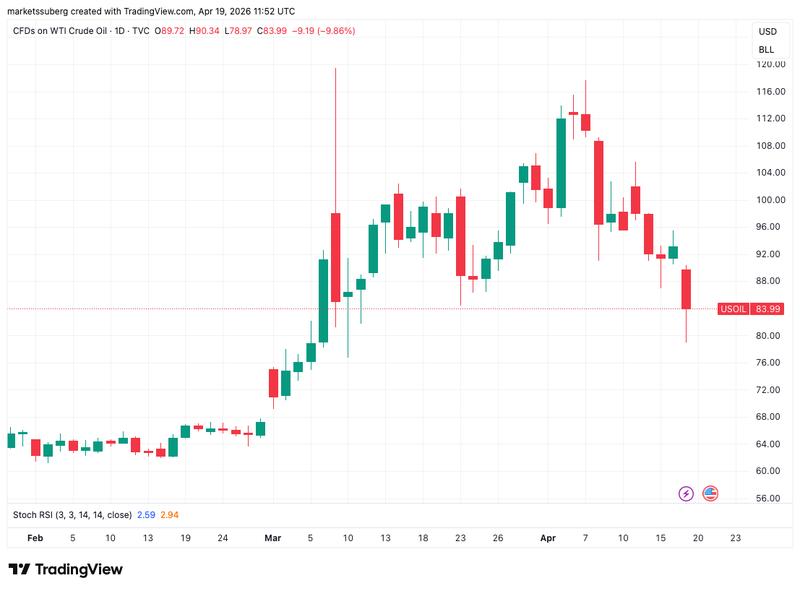
The renewed closure of the Strait of Hormuz represented one of the most recent developments, shifting attention toward oil futures for the day. Reports of a ceasefire had previously pushed WTI crude beneath the $80 per barrel threshold for the first time since March 10.
"We expect an eventful Sunday ahead," trading resource The Kobeissi Letter summarized in ongoing analysis on X.
While BTC/USD hovered near local peaks, and market sentiment along with it, traders maintained a cautious stance. Trading resource Material Indicators highlighted that the entire market sentiment could reverse based on relatively minimal catalyst activity, such as a social media post.
"Sentiment is overwhelmingly bullish at the moment, but that could change with one Tweet in the coming days. Know your invalidations," it told X followers.
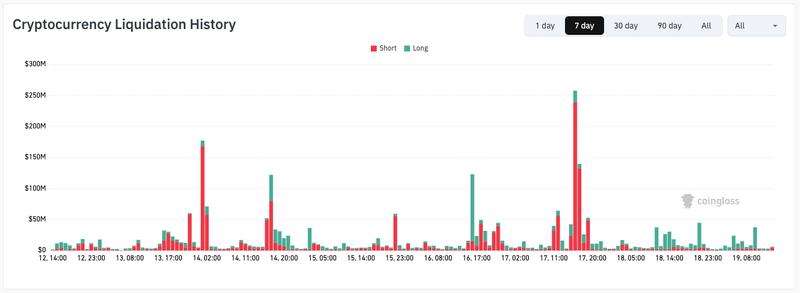
Information from CoinGlass revealed long positions experiencing pressure throughout the BTC price pullback, with aggregate crypto liquidations reaching $260 million over the past 24 hours.
BTC price capped by resistance trend line
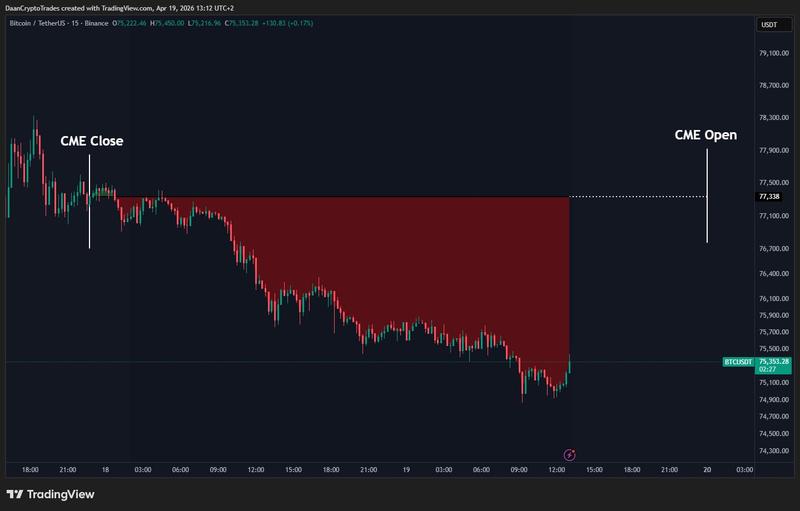
Meanwhile, trader Daan Crypto Trades focused attention on a potential gap forming in CME Group's Bitcoin futures market as it prepares to open following the weekend decline.
As Cointelegraph reported, such gaps often act as short-term price magnets when the new week begins.
"It's going to be interesting to see the futures open today and how $OIL will react to the recent headlines regarding the strait," he added.
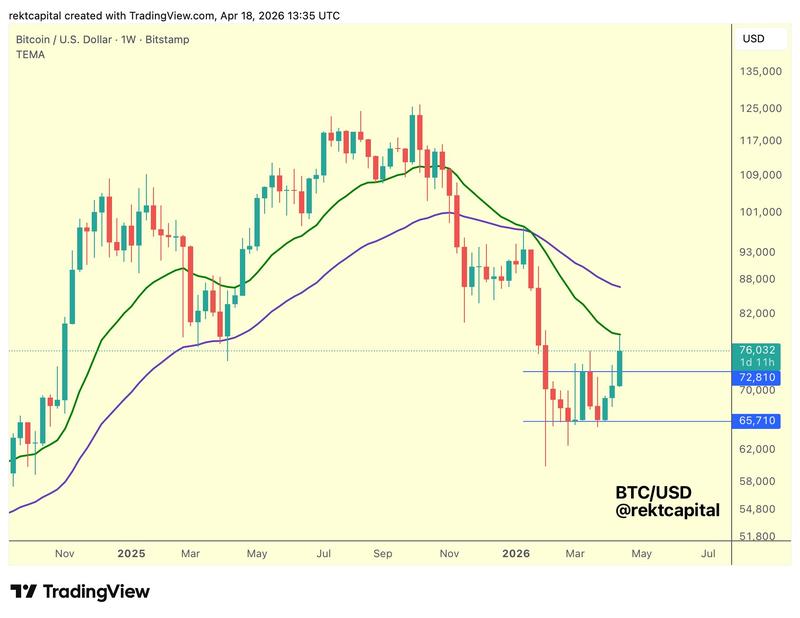
Examining the weekly close, trader and analyst Rekt Capital emphasized the significance of Bitcoin's 21-week exponential moving average (EMA) positioned near $78,900.
"Bitcoin is rejecting from the 21-week EMA (green)," he observed alongside the weekly chart.
"It is this rejection that could force a post-breakout retest of the top of the Double Bottom (~$73k) next week, provided Bitcoin Weekly Closes just like this."