BTC Surges Past $72K as Oil Tumbles — Can Bitcoin Sustain This Rally?
Following US President Donald Trump's announcement of a ceasefire deal with Iran, Bitcoin climbed back to the $72,000 level while oil prices plummeted beneath the $100 mark.

During Tuesday's trading hours in New York, Bitcoin (BTC) experienced a surge reaching $72,700 while oil prices descended below the $100 per barrel threshold following US President Donald Trump's announcement of a two-week ceasefire agreement with Iran.
Key takeaways:
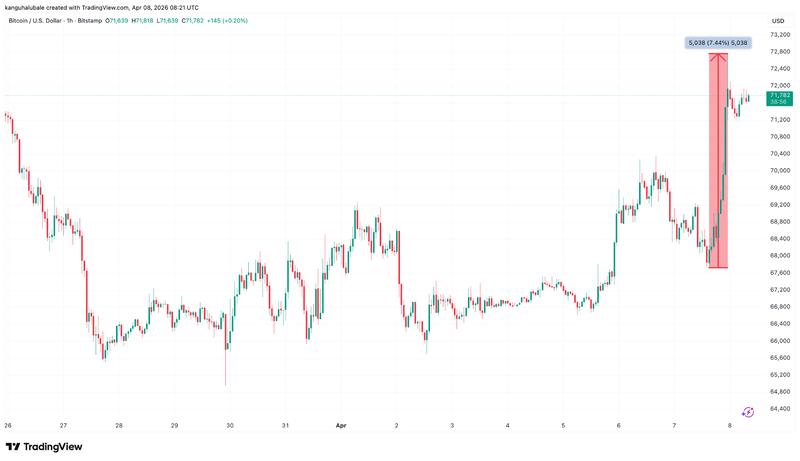
- Bitcoin rallied 7% to reach $72,700 on Tuesday following the announcement of a two-week ceasefire between the US and Iran.
- Short position liquidations exceeded $431 million over the past 24 hours.
- Market analysts indicate Bitcoin must decisively breach the $72,000-$76,000 zone to validate a trend reversal.
Bitcoin reaches three-week peak with 7% surge
According to data obtained from TradingView, BTC price experienced an increase of up to 7.4%, climbing to $72,760 from Tuesday's low point of $67,274, thereby recovering the entirety of losses accumulated throughout the previous 20 days. The most recent instance of BTC/USD trading above the $72,000 threshold occurred on March 18.
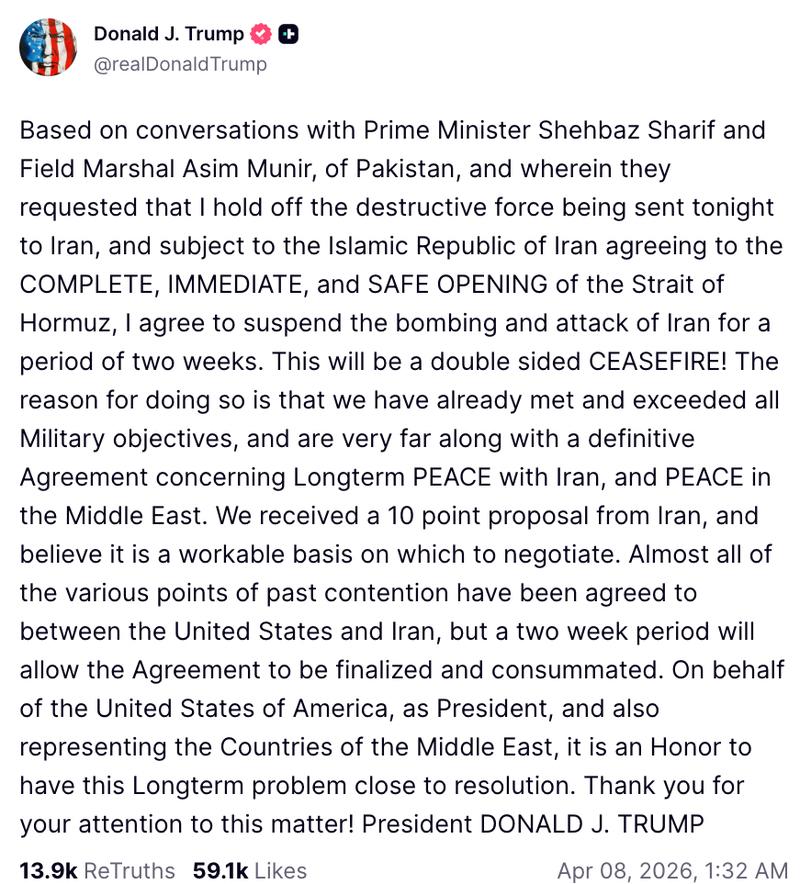
The market's price movement came as a response to Trump's announcement regarding a two-week ceasefire deal with Iran, which includes conditions requiring the "complete, immediate, and safe opening," of the Strait of Hormuz.
"Geopolitics moves crypto faster than any TA. One post from Trump and billions flow back into markets," analyst Mr Brondor said in response to Bitcoin's reaction following the news.
Bitcoin's upward movement coincided with $431 million worth of short liquidations during the previous 24-hour period, with liquidations of BTC shorts representing $214.8 million of that total.
The aggregate liquidations throughout the cryptocurrency market during the last 24 hours reached a total of $610 million.
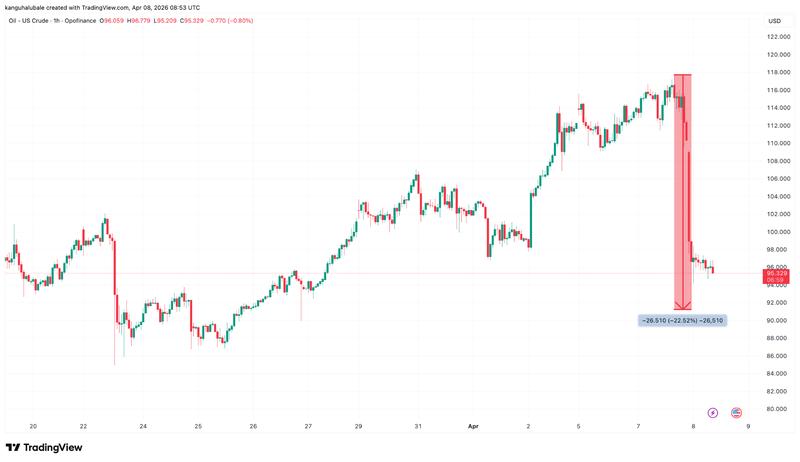
Oil prices, which had climbed above the $110–$118 per barrel range during the conflict period, experienced a decline of up to 16% falling to $92 from an intraday peak of $110, while WTI crude descended to $90, subsequently rebounding to $95, as of the time of publication.
Addressing BTC price movement, trading firm QCP Capital expressed the opinion that notwithstanding its recent gains, the overall market structure continues to be unstable.
"Hormuz reopening is conditional, infrastructure damage has already occurred, and Friday's talks will need to deliver tangible progress," it wrote in its latest "Market Color" update, adding:
"For now, the key question is whether that relief rally can hold through the next cluster of catalysts, including Fed minutes, CPI, and the first real diplomatic test of this two-week pause."
BTC price trend change still in question
Bitcoin continues to encounter bearish obstacles on its path to recovery, as traders express concerns regarding the potential repeat of a bear-flag breakdown pattern visible on the daily chart.
"BTC bulls still have a lot of work to do," crypto trader Jelle said in a post on X, adding:
"The argument for a bearish flag into key resistance remains strong."
The market analyst cautioned his followers against becoming "euphoric" regarding the current relief rally, suggesting it could encounter delays due to resistance from the flag's upper boundary, situated within the $72,000-$76,000 supply zone, as illustrated in the chart below.
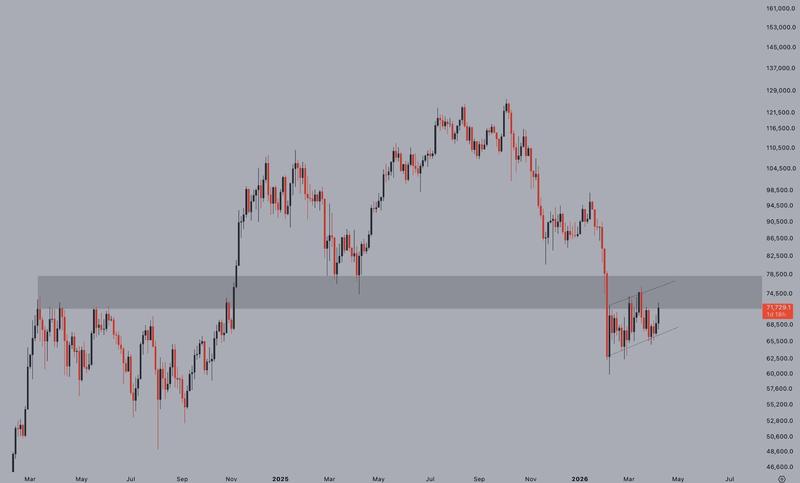
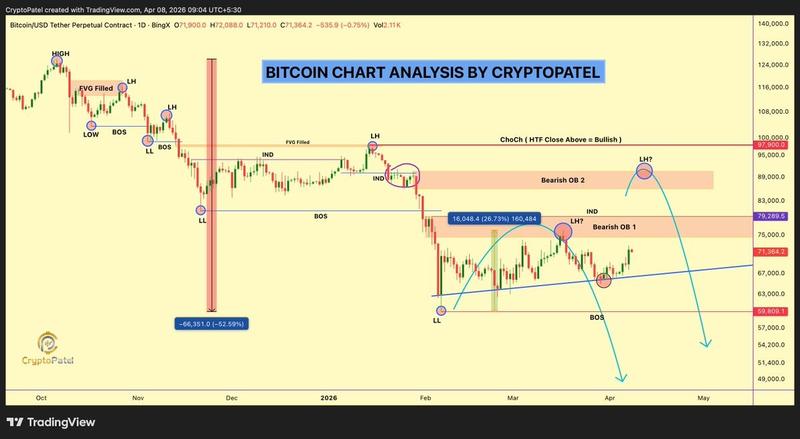
"Bitcoin reclaimed $72,000, but bears are waiting at this level," fellow analyst Crypto Patel said, adding that Bitcoin will "decide the next move" once it breaks above $76,000.
"HTF close above $76K → high chances BTC pushes toward $86K–$90K. Rejection from $76K → Next leg down below $60,000."
According to ongoing coverage by Cointelegraph, a significant number of traders anticipate another downward movement for BTC/USD toward the 200-week moving average alongside the realized price, both of which have traditionally indicated bear market bottom formations.