BTC Retreats Below $70,000 Mark: Three Critical Factors Explained
Short-term BTC holders cashing out profits drove the Bitcoin decline beneath $70,000, though both spot and futures market participants could trigger a rapid rebound.

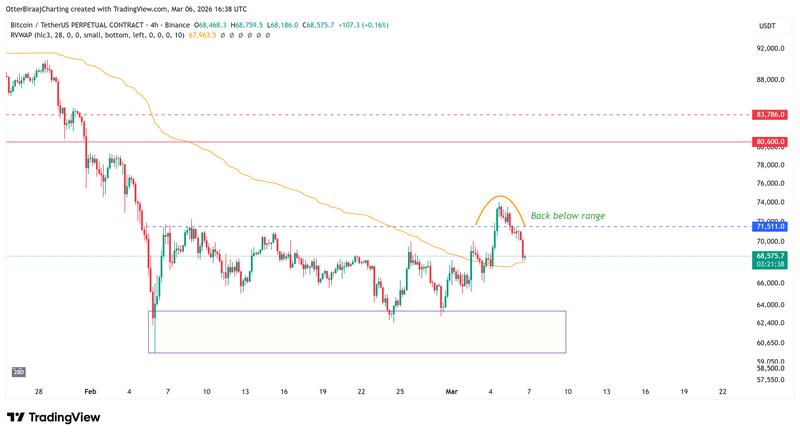
Bitcoin (BTC) has retreated into its monthly price range beneath the $70,000 threshold following a 5% decline across the previous two trading days.
Data from the cryptocurrency market indicates significant resistance forming around the $70,000 price point, as onchain transaction flows, derivatives market information, and diminishing spot trading volumes indicate fresh waves of selling activity that restrict BTC's capacity to maintain this week's elevated price levels.
BTC short-term holders locked in profit
The rush to realize gains among short-term holders (STHs) intensified as Bitcoin's price surged past the $74,000 mark. Cryptocurrency analyst Darkfost reported that over 27,000 BTC with accumulated profits were transferred to trading platforms from STH addresses during the last 24-hour period.
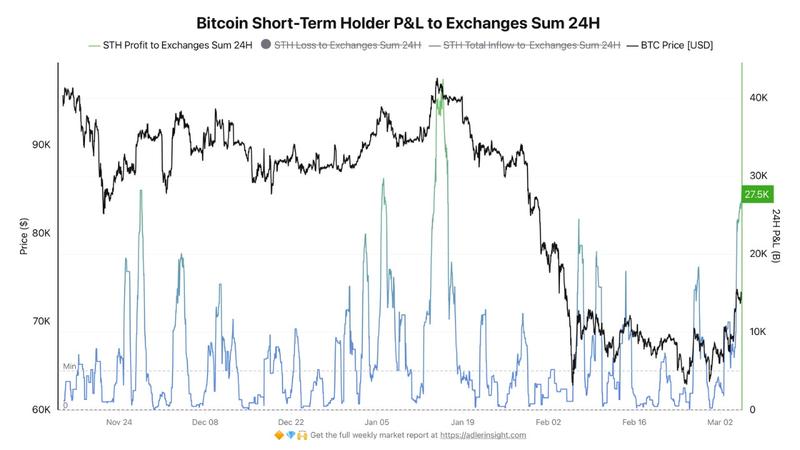
This surge represents one of the most substantial profit-taking movements from this particular investor group since November 2025.
According to Darkfost, these market participants managed to secure profits that were primarily built up during the one-week to one-month timeframe, given that their realized purchase price hovered around $68,000.
Data from Bitcoin derivatives markets revealed a comparable trend of intensive selling behavior. Market analyst IT Tech observed that both the spot market and perpetual futures market recently switched to negative territory on the cumulative volume delta (CVD) metric. The CVD calculates purchasing volume subtracted by selling volume. When the reading turns negative, it indicates prevailing selling momentum.
Based on the analyst's findings, the spot CVD declined to –$202.49 million whereas perpetual futures CVD fell to –$185.60 million. Bitcoin descended below the $70,000 level throughout this identical timeframe, as purchasing liquidity withdrew from the marketplace.
Coinbase premium index signals fading demand
Demand from spot traders based in the United States also diminished around critical price turning points.
The Coinbase Premium Index, which tracks the Bitcoin price differential between Coinbase and international trading platforms, has consistently weakened as BTC neared $74,000. Positive indicator readings typically reflect elevated US spot market demand.
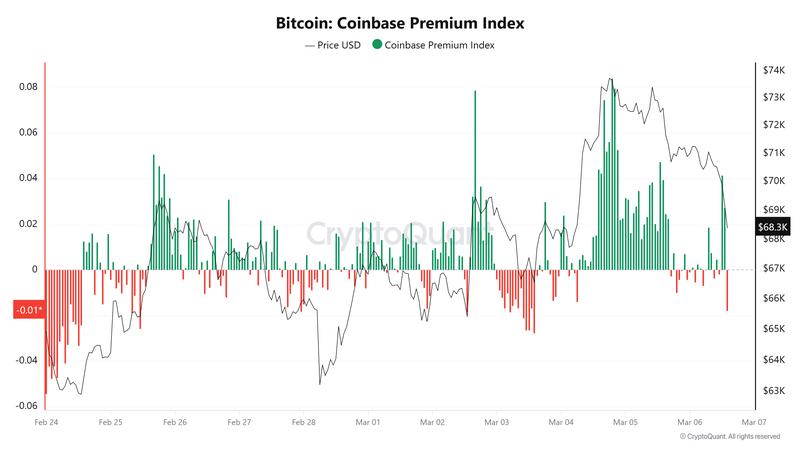
Throughout Bitcoin's upward movement toward the $73,000–$74,000 price corridor on March 4, the premium momentarily jumped above 0.08, demonstrating robust purchasing activity from entities utilizing Coinbase.
This momentum rapidly dissipated as the price retreated from $74,000, and the premium subsequently reversed into negative territory.
Michaël van de Poppe, founder of MN Capital, stated that the Friday US trading sessions have lately generated widespread market liquidation across risk-oriented assets, including the Nasdaq.
Van de Poppe further suggested that Bitcoin maintaining support within the $67,000–$68,000 range could stabilize the near-term price trajectory ahead of a subsequent upward movement.
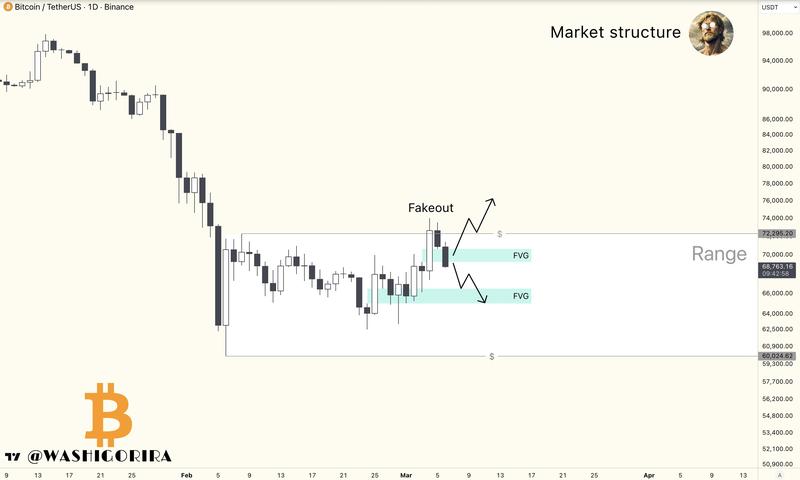
Furthermore, cryptocurrency trader Titan of Crypto highlighted a proximate fair value gap (FVG) that might facilitate price consolidation. An FVG develops when the price advances rapidly and creates a low-liquidity zone where limited trading activity transpired during a breakout. From a technical perspective, the price may return to these areas to rebalance the liquidity distribution.
The bottom edge of that gap is positioned near $66,500, which the trader is observing as a more substantial liquidity area.