BTC Price Climbs as U.S. Inflation Reaches Three-Year Peak: What's Next for Bitcoin?
Despite facing multiple technical resistance barriers, Bitcoin's recent recovery appears to be losing momentum, increasing the likelihood of prices falling beneath $60,000 before the end of June.

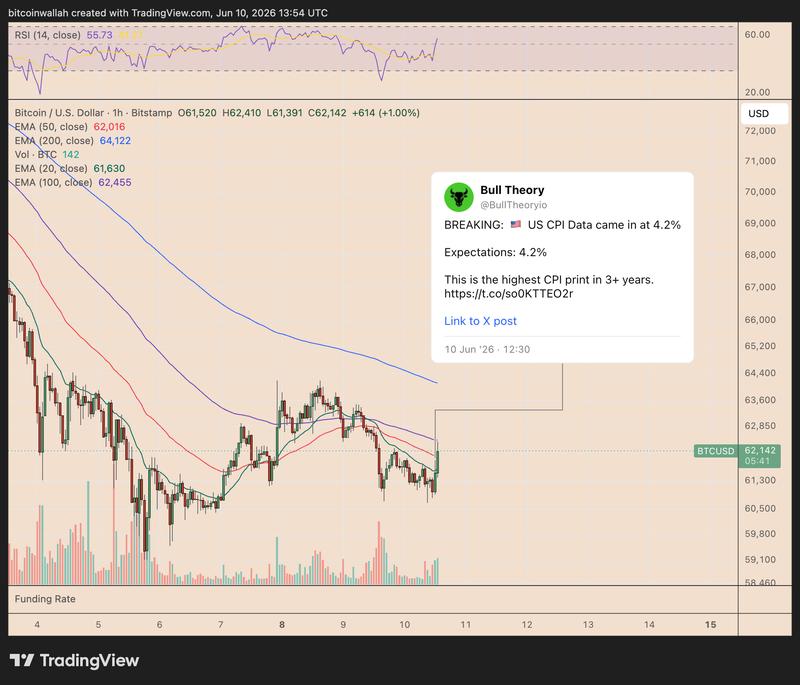
In the wake of the latest U.S. inflation data release, Bitcoin (BTC) managed to reverse earlier losses and climb approximately 2.5% to reach $62,410, despite the fact that the headline Consumer Price Index (CPI) registered its most elevated reading in over three years.
Key takeaways:
- Bitcoin rose as the latest US CPI reading matched economists' expectations.
- BTC still faces short-term downside risks as it trades below strong resistance levels.
U.S. May Inflation Data Aligns With Forecasts
The U.S. Consumer Price Index experienced a 4.2% year-over-year increase during May. When examined on a month-to-month basis, headline inflation climbed 0.5%, whereas core inflation—which strips out volatile food and energy components—registered a 2.9% annual gain and a 0.2% monthly advance.
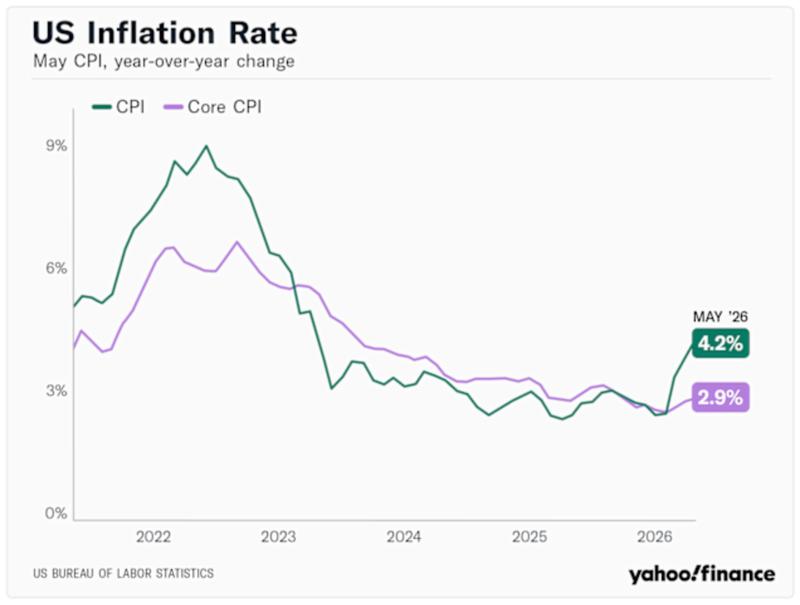
The surge in the headline figure was predominantly driven by escalating energy and gasoline costs, as heightened geopolitical tensions in the Middle East pushed oil prices upward and rekindled worries about inflation.
On the surface, the inflation report appeared to signal negative implications for Bitcoin. Elevated inflation generally diminishes the likelihood of interest rate reductions by the Federal Reserve, maintains Treasury yields at higher levels, and creates tighter financial conditions. These factors typically apply downward pressure on risk-oriented assets, crypto included.
However, BTC experienced a rally because the inflation data failed to exceed the most pessimistic projections.
Economic analysts had previously anticipated the headline CPI would reach 4.2%. Since the reported figure aligned with these projections, it eliminated concerns about an unexpectedly hotter reading.
Market participants interpreted the report as insufficiently strong to compel the Fed toward adopting a more aggressive policy position, which provided them with justification to resume purchasing risk assets.
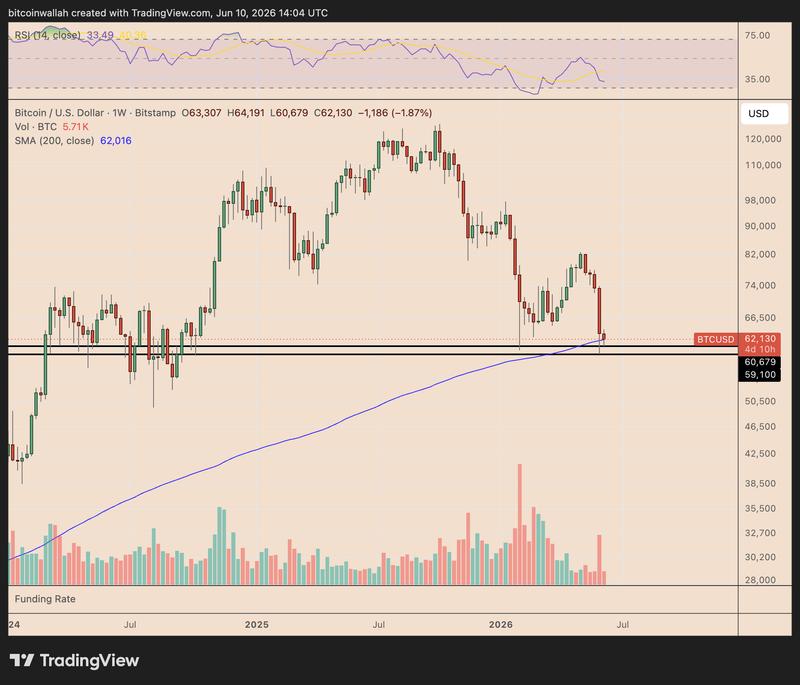
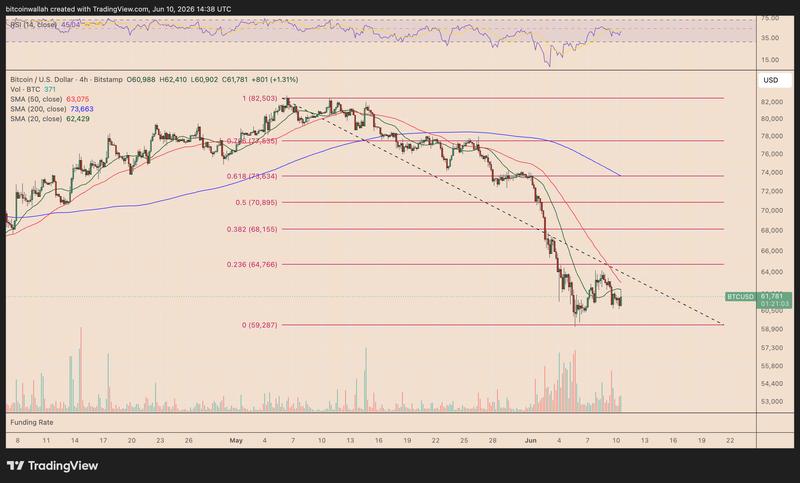
This dynamic allowed Bitcoin to rebound from critical long-term support areas, including the 200-week exponential moving average (200-week EMA, represented by the blue line) and the important psychological support zone between $60,000 and $62,000, as illustrated in the chart below.
Does Bitcoin's Recovery Signal a Bullish Trend Reversal?
The post-CPI bounce in Bitcoin's price has not yet provided confirmation of a comprehensive bullish trend reversal.
When analyzing the technical indicators, BTC continues to trade beneath critical near-term resistance barriers, which include the 20-period simple moving average, displayed in green, along with the 50-period simple moving average, shown in red, when examining the four-hour timeframe chart.
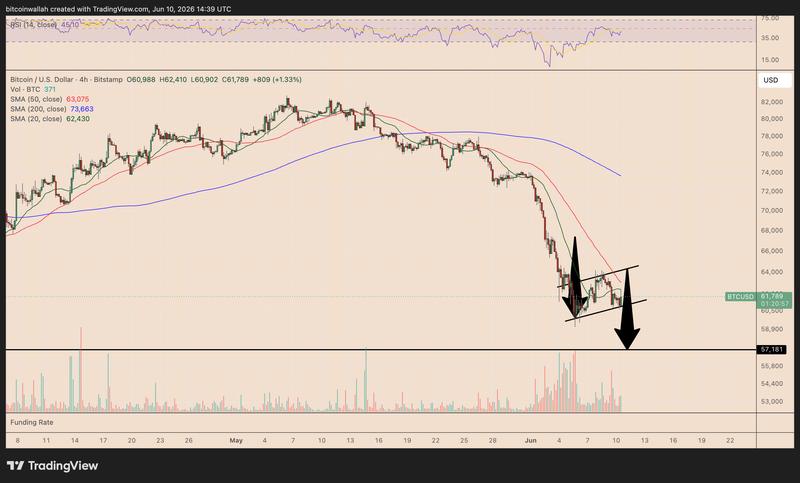
Additionally, BTC seems to be trading within the confines of a bear flag chart pattern.
This technical formation develops when price action recovers within an upward-slanting parallel channel following a steep decline. Put simply, the recovery might merely represent a temporary pause before another downward movement begins, rather than marking the beginning of a fresh upward trend.
According to conventional technical analysis principles, a bear flag pattern receives confirmation when the price breaches the lower boundary of the flag's trend line. The projected downside target is calculated by measuring the height of the preceding selloff and projecting that distance downward from the breakout point.
Based on this methodology, Bitcoin's bearish price target sits around $57,800 for June, representing approximately a 7.6% decline from present price levels.
Alternative Scenario: Bitcoin Relief Rally Remains Possible
On the other hand, a decisive breakout above the confluence of resistance levels—which consists of the 20-period SMA, the 50-period SMA, and the upper boundary of the flag pattern—would undermine the bear flag formation and negate the immediate bearish outlook.
Under such circumstances, Bitcoin would have the potential to continue its upward recovery movement toward the $64,000 to $68,000 price range during June, which corresponds with the 0.236 and 0.318 Fibonacci retracement levels.