BTC Longs Surge to Protect $70K Floor: Can Bulls Withstand Ongoing ETF Withdrawals?
BTC declined toward a key support zone after attempts by spot and futures long traders to maintain $75,000 proved unsuccessful. Could Bitcoin fall below $70,000?

The increasing funding rate and cumulative open interest for Bitcoin (BTC) indicate that optimistic traders are establishing long positions in a bid to protect the lower range boundaries and a crucial support zone at $70,000, though continued withdrawals from spot ETFs have market participants worried that institutional sentiment toward BTC may be changing.
The chart presented below demonstrates that Bitcoin's open interest has stayed reasonably consistent despite ongoing daily selling pressure, which strengthens the perspective that existing long positions are being reinforced to remain viable or that fresh positions are being initiated. The funding rates across multiple exchanges (displayed as the final indicator toward the chart's base) are predominantly positive or neutral, signaling a preference toward long positions among market participants.
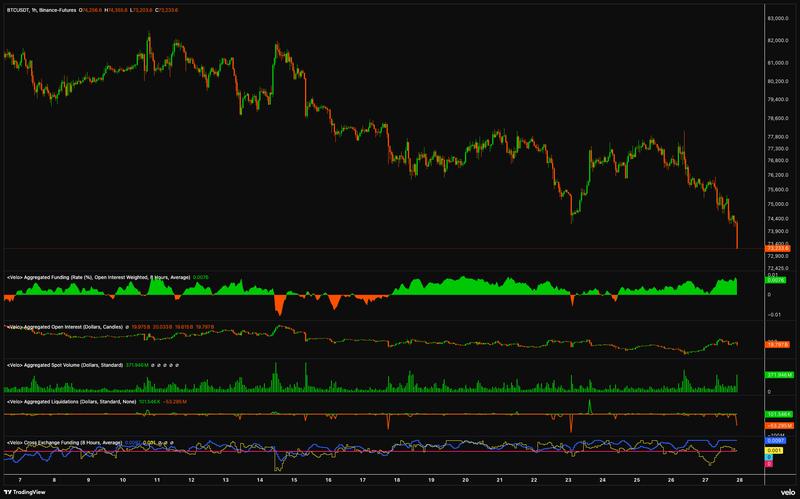
Before the decline toward $73,000, liquidation events stayed within typical parameters relative to BTC's daily trading range on a percentage basis, which suggests that this week's market movements represent a prolongation of the ongoing consolidation phase instead of preliminary validation of a broader timeframe trend reversal.
A crucial consideration involves identifying "who" exactly is maintaining BTC's price levels. The True Retail Longs & Shorts Accounts indicator from Hyblock reveals that retail market participants are progressively treating price corrections as chances to purchase at lower levels.
Analysts at Hyblock stated that,
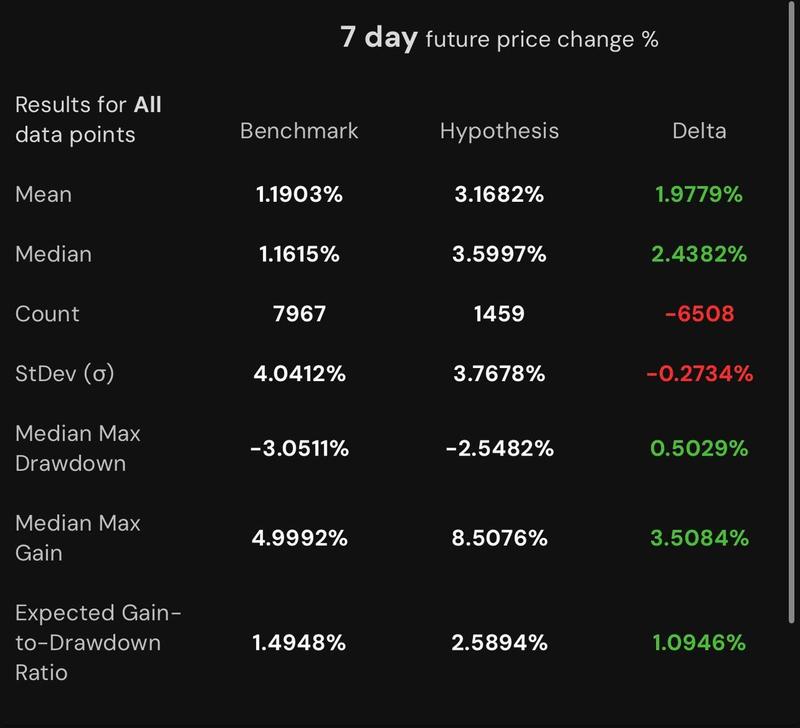
Long exposure now sits near 62%, a level where retail traders have historically been vulnerable to getting trapped. Over the last three months, backtested 15-minute data shows that when retail long positioning was above 62%, BTC posted positive returns 82% of the time seven days later, with a median forward return of 3.6% across 1,459 occurrences.
Withdrawals from ETFs, unfavorable Coinbase premium offset actions by spot and perpetual traders
Bitcoin market participants are exercising "cautious heading into Thursday's (May 29) Personal Consumption Expenditures (PCE) report for April," according to analysts from Bitfinex.
The analysts stated,
Since 15 May, futures open interest (OI) has fallen sharply following a price correction that has seen BTC fall over 10 percent from recent highs above $82,000. Bitcoin's aggregated global OI has now dropped back below $55 billion, the lowest reading since 11 April, and is down 14 percent from when BTC was trading above $80,000.
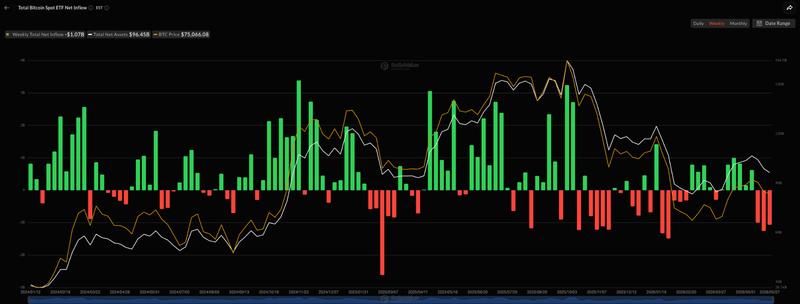
During Wednesday's trading session, withdrawals from Bitcoin spot ETFs surpassed $200 million, whereas total outflows throughout the preceding 7 days went beyond $1.5 billion. Beyond the shift in ETF capital movements, Bitfinex highlighted the unfavorable Coinbase premium as representing a "significant warning sign."
"In the post-ETF landscape, this reflects a structural reality: direct US spot demand on Coinbase has been largely displaced by indirect institutional demand via ETFs, structured products, and over-the-counter desks."
The analysts observed that despite Bitcoin's price being "in an uptrend on the lower timeframes since the breakout" from $72,000, "the continuation set-up is absent."
A strong uptrend is typically driven via the spot tape, which would mean persistent negative funding rates and a persistent positive Coinbase premium. The opposite is the case at present.