BTC Faces Potential Decline to $72K Amid Demand Indicators Reaching 2026 Lows
Declining demand for Bitcoin has proven insufficient to counter rising sell-side pressure, increasing the likelihood of BTC prices falling further toward the $72,000 level.

Bitcoin (BTC) has experienced a 6.5% decline from its latest peak exceeding $82,000, with technical indicators turning bearish, demand showing weakness, and selling pressure mounting—all factors pointing toward the possibility of additional downside movement.
Key takeaways:
- The BTC price faces potential downward movement toward the $72,000 mark as bearish momentum gains strength across extended time frames.
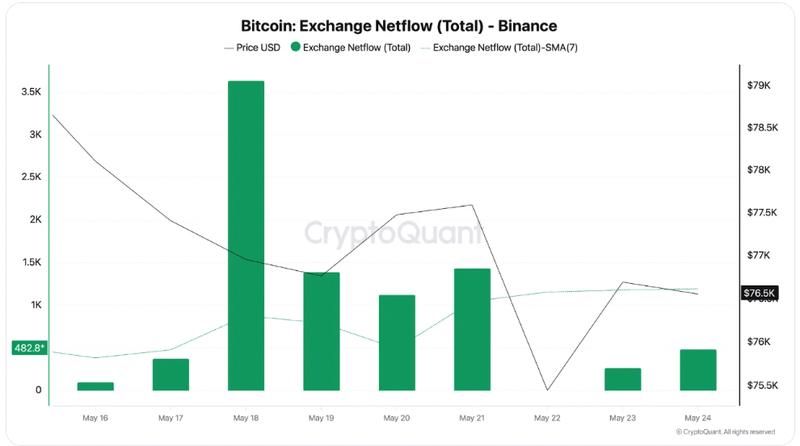
- BTC inflows to Binance have seen a threefold increase within a span of less than fourteen days, indicating heightened selling pressure and diminishing market confidence among investors.
- The apparent demand for Bitcoin has reached its lowest point in 2026, elevating the risk of more substantial losses should spot demand not rebound in upcoming weeks.
Bears targeting BTC price movement toward $72,000
The inability of Bitcoin to maintain its position above critical support thresholds indicated that purchasing interest was insufficient to preserve upward price movement.
"$BTC has officially lost the 100 & 50d EMA," market analyst CryptoJelleNL stated in a recent publication on X, further noting:
"The local market structure is back to bearish."
"Bitcoin lost its bullish impulse exactly when macro sharply deteriorated," fellow market analyst Axel Adler Jr stated in a Sunday publication on X, further commenting:
"The market looks risk-off, and every BTC bounce remains unconfirmed."
The pullback at the $82,000 threshold aligned with the upper boundary line of an ascending parallel channel pattern, a formation that has contained BTC's price movements since the beginning of February.
The accompanying chart reveals that each instance where the price has faced rejection from this particular trend line has resulted in losses ranging from 11% to 14% of its valuation, with prices retreating toward the lower supporting trend line.
Should this historical price pattern persist, Bitcoin is projected to decline toward the channel's lower boundary positioned at $72,000, representing a 13% decrease from the upper boundary and approximately 7% below current trading levels.
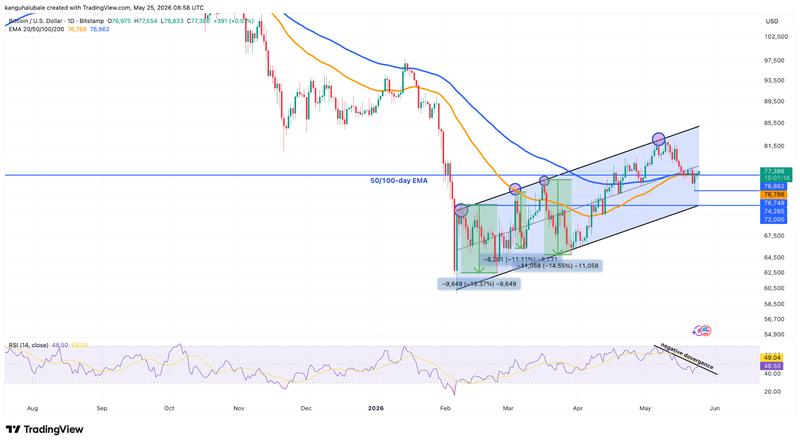
Concurrently, the relative strength index has fallen to 48 from near overbought territory at 69 recorded on May 6, indicating growing downward momentum in the market.
"Bitcoin briefly dipped as low as $74.1K, sweeping the May VCPR liquidity zone before seeing a quick reaction," market trader and analyst Anup Dhungana stated in his most recent analysis posted on X, further explaining:
"Losing this support area could send $BTC swiftly back toward the $70K region, while holding it keeps the door open for another recovery attempt."
Michael van de Poppe, the founder of MN Capital, presented a chart illustrating that should the "crucial" support zone ranging from $75,000 to $76,000 be breached, the price may pull back toward subsequent defense levels positioned at $74,000 and $71,400, before possibly retesting the 2026 lows established at $60,000.
Conversely, Van de Poppe indicated that BTC/USD has the potential to advance to "higher grounds" surpassing $80,000 if "there's going to be a peace deal in the Middle East" materializing in the near future.
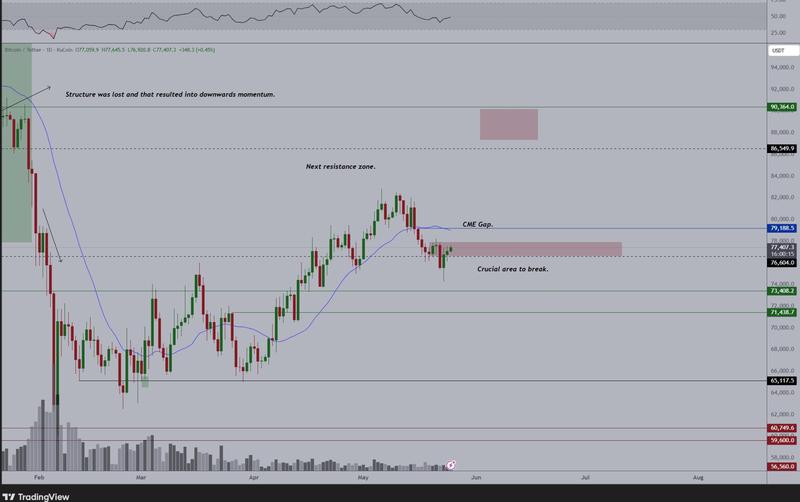
According to reporting from Cointelegraph, the $76,000 price level represents the critical threshold requiring close monitoring, given that a closing price beneath this level would amplify the probability of a decline toward the multi-month support line positioned around $72,000.
Bitcoin's apparent demand reaches 2026 lows
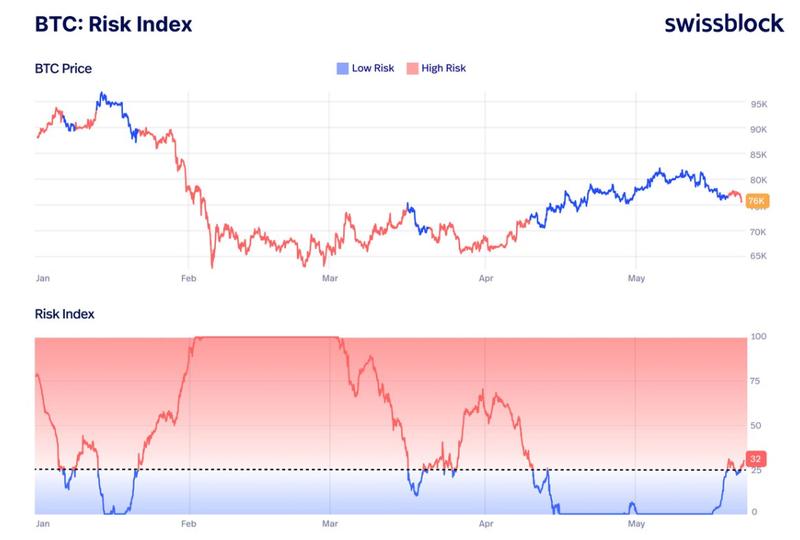
A "warning is flashing" for Bitcoin following its Risk Index's return to "high-risk" territory, as reported by private wealth management firm Swissblock.
"That doesn't confirm breakdown yet," Swissblock commented in a recent publication on X, further adding:
"But it confirms that selling pressure is no longer being fully absorbed."
This high-risk warning also corresponds with mounting selling pressure observed on cryptocurrency exchanges, with Binance documenting approximately 10 consecutive days of net BTC inflows. The average weekly inflows climbed to 1,190 BTC from 378 BTC recorded on May 16, representing an increase of more than three times within less than a two-week period.
"When inflows become dominant and consistent on a platform like Binance, this is traditionally interpreted as a potential sell signal," CryptoQuant analyst Darkfost explained in a QuickTake note published on Monday, further elaborating:
"Holders transferring their BTC to an exchange most often do so with the intent to sell, whether it be profit taking, reducing exposure, or a more defensive repositioning."
In parallel developments, Bitcoin's apparent demand has descended to approximately -147,000 BTC, marking its most negative reading since the year began and representing the weakest measurement recorded since December 2025.
"This development suggests that demand continues to gradually contract," Darkfost stated in a publication on X posted on Sunday, further observing:
"Without a meaningful recovery in spot demand, it becomes difficult to imagine Bitcoin sustaining a durable rally."
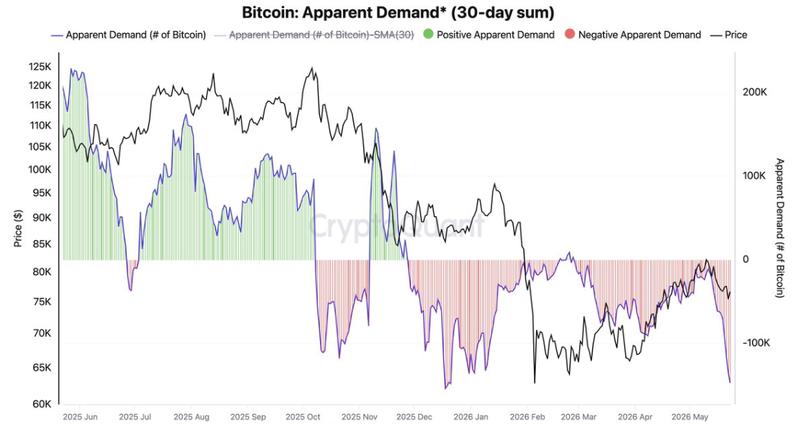
The previous occurrence of this metric reaching such depressed levels was documented in December 2025, preceding an additional 33% decline to multi-year lows falling below $60,000, which was ultimately reached on Feb. 6.
As previously reported by Cointelegraph, the deteriorating demand for Bitcoin combined with expanding spot ETF outflows has elevated the risk of extended consolidation or a potential decline toward $65,000 within the short to medium-term timeframe.