Bitcoin poised for continued gains as analysts pinpoint critical resistance zones
Market experts indicate Bitcoin maintains potential for additional growth, though resistance may emerge near BTC's active supply cost basis around $78,000.

According to market experts, Bitcoin's (BTC) recent surge toward $76,000 represented a "clear momentum shift," validating a short-term bullish trajectory for BTC price action.
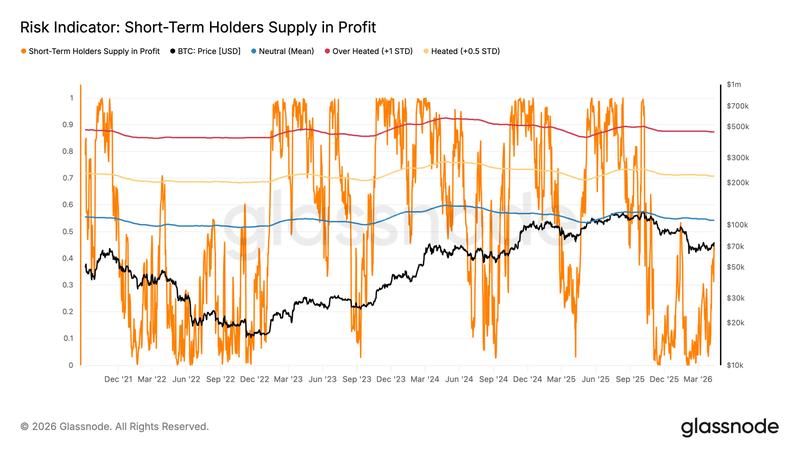
Data from Glassnode reveals that Bitcoin's short-term holder (STH) supply in profit—a metric measuring the proportion of recently purchased coins currently showing unrealized gains—indicates that BTC/USD still has momentum left in its bear market recovery.
Throughout history, local peaks during bear market rallies have typically emerged when this indicator reaches its statistical mean of 54.2%, representing a concentration level of profitable STHs substantial enough to initiate significant selling pressure.
"This leaves slight room for further upside toward the True Market Mean, while also providing a quantitative level to monitor as price advances."
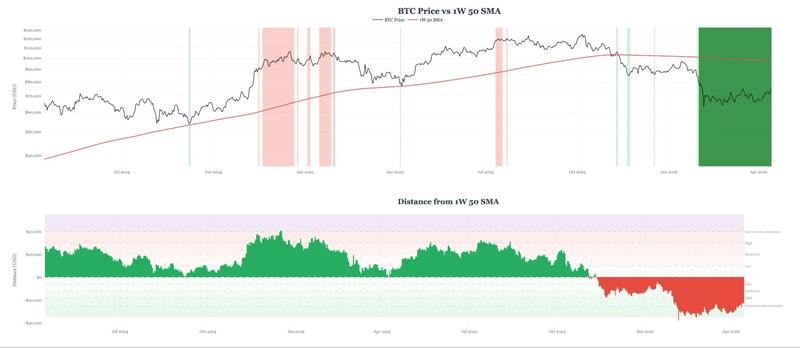
At the same time, Bitcoin continues to trade in "deep under extension territory" when measured against its 50-week simple moving average (SMA), which currently stands at $96,800, according to analyst McKenna in a recent X platform post.
Historical patterns demonstrate that when markets extend significantly in either direction, they typically return toward their mean values.
When combined with "clear momentum shifts and bullish trending signals firing then I would be inclined to be directionally bullish here, the analyst noted, further stating:
"BTC breaking above $74K and holding this level on a HTF is the final trigger I want to see to be confident in mid to high 80s over the coming weeks."
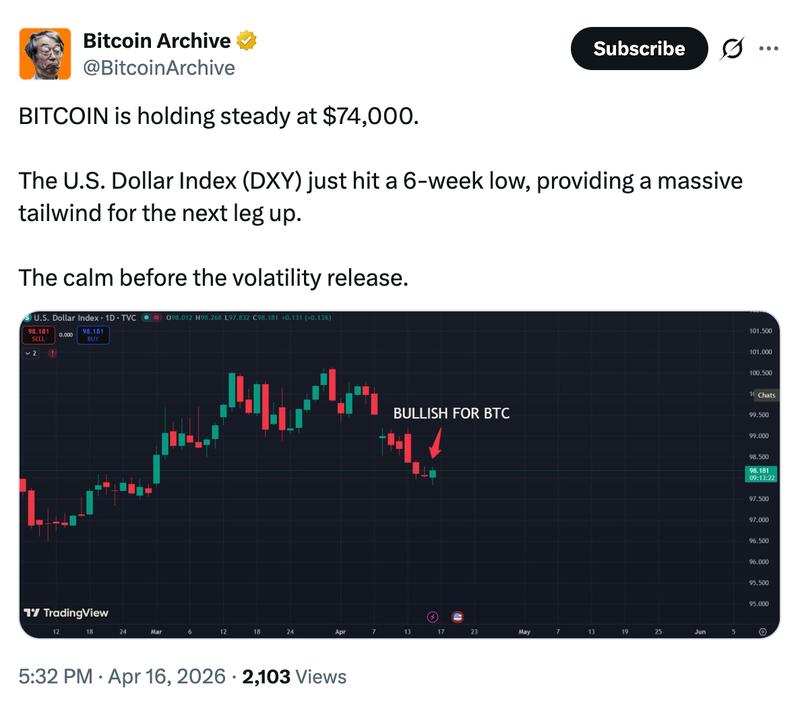
Another analyst, Bitcoin Archive, highlighted the declining US dollar index, stating that it creates a "massive tailwind for the next leg up" for Bitcoin.
According to Cointelegraph's earlier reporting, multiple metrics indicate Bitcoin's capacity to climb higher, encompassing rising network activity and an improving technical configuration.
On-chain metrics highlight critical Bitcoin price thresholds
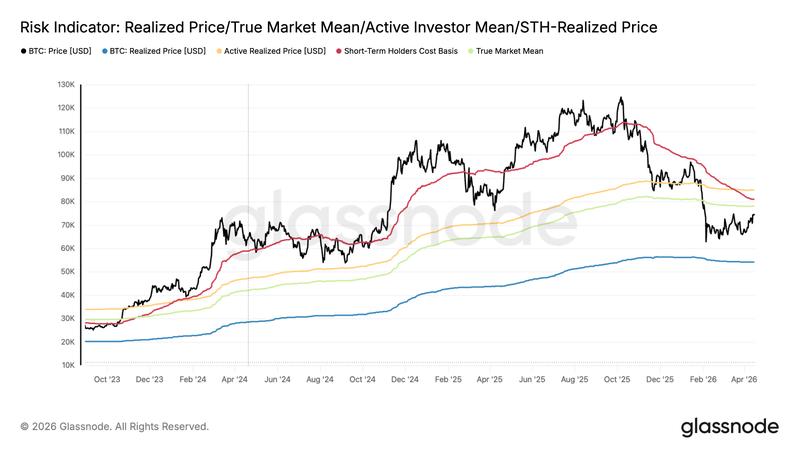
The 41% decline Bitcoin experienced from its $126,000 all-time high has pushed the BTC/USD pair beneath several important pricing thresholds, including the active realized price at $85,100, the STH cost basis at $80,950 and the true market mean presently at $78,140.
Trading at $74,000, Bitcoin sits 5.2% beneath the true market mean, which represents a metric that tracks the cost basis of active BTC supply.
Although the price has not yet managed to "test and stabilize above this key threshold, the probability of a spike toward and potentially above it remains considerable in the mid-term," according to Glassnode's analysis.
The significance of this resistance zone is further validated by the cost basis distribution data. Analysis of the heatmap displayed below indicates that more than 200,000 BTC were purchased at approximately $78,000.
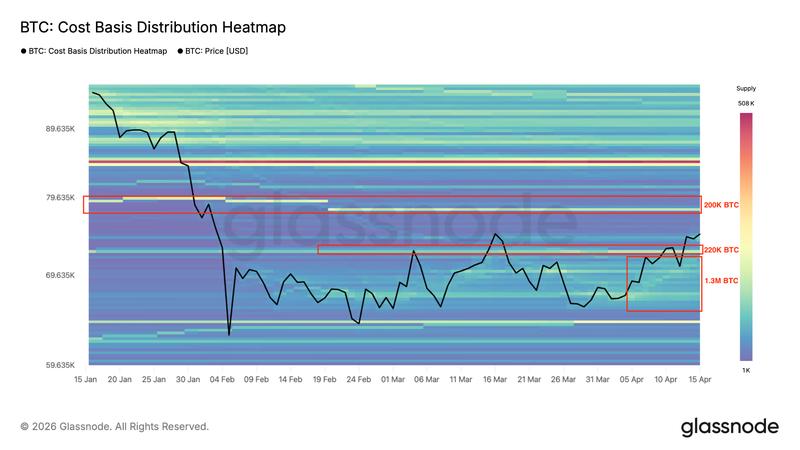
Looking at potential downside scenarios, the initial significant support level emerges at $72,000, a zone where the 20-day and 50-day exponential moving averages (EMAs) seem to be converging. This price point also represents where market participants accumulated roughly 220,000 BTC.
Beyond that level, the $65,000-$70,000 demand area represents a crucial zone worth monitoring closely. This particular price range has demonstrated historical importance as a significant support level, evidenced during the October through November 2024 period, acting as a foundation for the rally that extended from October 2024 through January 2025.
According to previous Cointelegraph coverage, a breakdown beneath the $70,000 threshold would signal that bearish forces have regained dominance, heightening the likelihood of a further decline toward $60,000.