Short positions opened above $70K face liquidation threat as Bitcoin downside nears completion
Analysis of BTC pricing indicators reveals Bitcoin continues to trade below fair value while traders holding short positions from $70,000+ levels face elevated liquidation risks.

Analysis of Bitcoin (BTC) futures market activity reveals that market participants who initiated fresh short positions when prices traded above $70,000 during the weekend period may now be facing significant liquidation exposure following Monday's closure of numerous leveraged positions.
Data tracking the weekly variation in Bitcoin futures market open interest registered a decline to -2.46% as of Monday, representing a substantial shift from the 8.9% surge recorded on March 31, indicating a reduction in overall market leverage.
Several long-term Bitcoin pricing models are currently positioned at historically low levels, with market observers calculating that approximately 90% of potential downward movement has already been incorporated into current valuations.
Bitcoin futures leverage reset meets rising short bias
Bitcoin analyst Axel Adler Jr highlighted the weekly fluctuation in cumulative Bitcoin futures open interest (OI) when measured in BTC terms. This particular metric reached its zenith at 8.9% on March 31 as Bitcoin's value climbed beyond $73,000. By April 4, the reading had reversed to -7.2%, representing the most severe contraction observed during the timeframe. The seven-day variation currently registers at -2.46% on Monday, with aggregate OI hovering around 318,000 BTC.
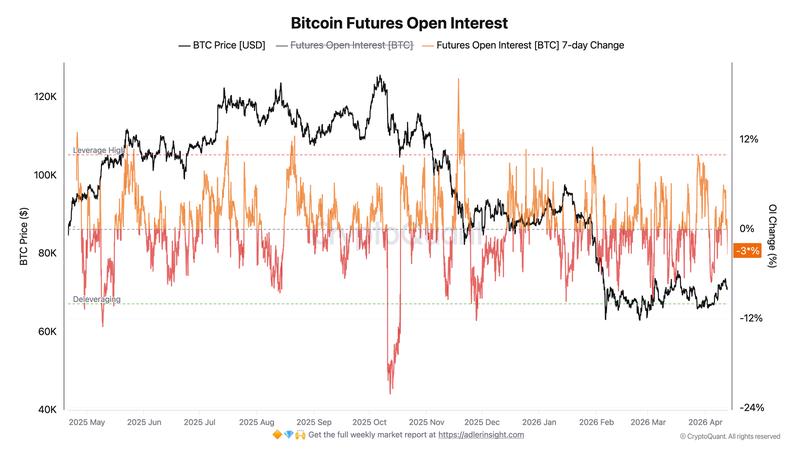
The transition into negative territory took place on Sunday, positioning the deleveraging cycle in its initial phase. Adler noted that Bitcoin's ability to maintain values above $70,000 throughout this contraction period demonstrates that a significant portion of leveraged long positions have been unwound without triggering a cascade of forced liquidations that would have caused BTC prices to collapse.
Open interest metrics do not differentiate between positions closed voluntarily and those liquidated by force, meaning the movement should be interpreted as a comprehensive leverage reset across the market.
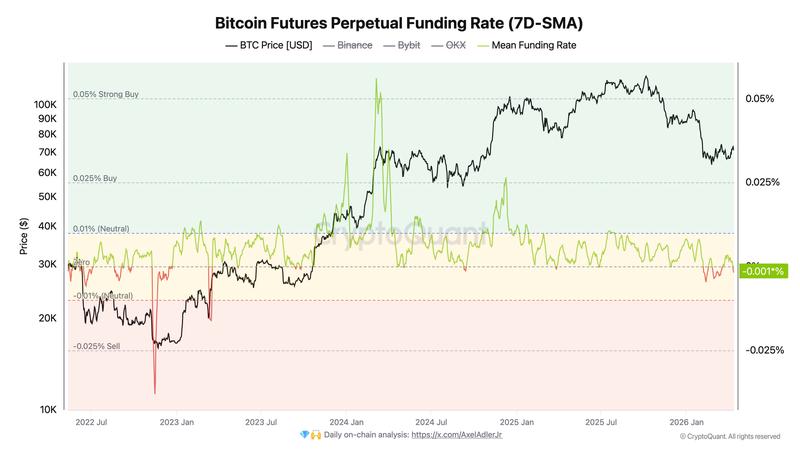
Funding rate information provides an additional analytical dimension. The seven-day average funding rate measured across Binance, Bybit and OKX has declined from 0.33% on March 31 to -0.1738% by April 13.
Both Bybit and OKX display more pronounced negative readings, indicating a more substantial bias toward short positioning. When funding rates turn negative, it means short sellers are compensating long holders to maintain their positions.
This dynamic suggests mounting pressure on traders holding short positions should prices remain stable, given that the positioning bias is working against the prevailing upward trend.
The present market configuration reveals that leveraged long positions experiencing stress were closed initially, followed by new short positions entering the market. Bitcoin maintaining stable pricing above $70,000 against the backdrop of this positioning shift establishes circumstances where recently opened short exposure becomes vulnerable to a squeeze should demand for BTC resurface.
Data says Bitcoin is still undervalued
Michaël van de Poppe, Founder of MN Capital, drew attention to three long-term analytical indicators currently positioned at exceptionally low readings. The Puell Multiple Z-Score, an indicator that compares Bitcoin mining revenue against historical norms, has reached its most depressed level in ten years. Comparable readings previously emerged in proximity to the 2018, 2020, and 2022 BTC price troughs.
The spent output profit ratio (SOPR) Z-Score, which monitors whether coins are being sold for gains or losses, has declined to its lowest recorded value. This reflects widespread loss realization across the market, a characteristic frequently observed during exhaustion phases.
The market-value-to-realized-value (MVRV) Z-Score has similarly registered its most depressed reading on record, positioning the BTC price in close proximity to aggregate cost-basis areas.
When viewed collectively, these analytical tools indicate that the majority of market participants are no longer holding positions with substantial unrealized gains, and much of the previous euphoric accumulation activity has dissipated.
This pattern of reset frequently occurs in the aftermath of significant selling activity, during which short-term oriented traders liquidate their holdings and coins transfer to investors maintaining a longer-term investment horizon.
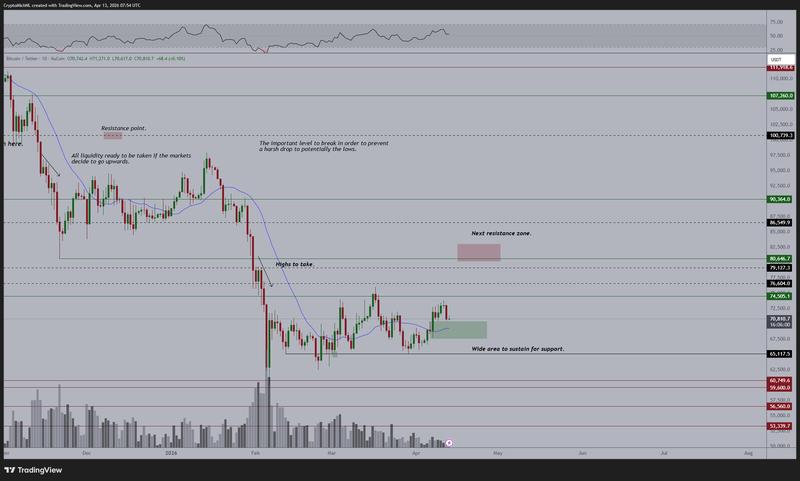
Although the price range spanning $64,000 to $66,000 displays observable liquidity concentrations, $74,000 continues to function as a resistance level that has been tested. Van de Poppe stated,
"For sure, markets can tumble and sweep the lows for liquidity, but I don't think we'll see much more downside in the markets, or at least 90% of the downside is already captured."