Crypto analysts identify crucial BTC price targets as Bitcoin climbs above $63K following Trump's Iran remarks
BTC participates in broader risk-on market rally amid prospects of fresh Iran negotiations, with market observers monitoring daily candle close levels.

Following Wall Street's Thursday opening bell, Bitcoin (BTC) achieved intraday peaks as equities in the United States rallied on renewed optimism surrounding Iranian peace negotiations.
Key points:
- BTC participates in a broader risk-on rally following US President Donald Trump's statement that Iran is seeking to "make a deal" in the wake of ceasefire collapse.
- Cryptocurrency short position liquidations approach $100 million within a 24-hour period.
- Market analysts identify critical BTC price thresholds that could materialize by the daily close.
Digital assets and equities climb following Trump's Iran "deal" hints
According to data captured by TradingView, the BTC/USD trading pair climbed back beyond the $63,000 threshold, registering an increase of approximately 1.5% for the trading session.
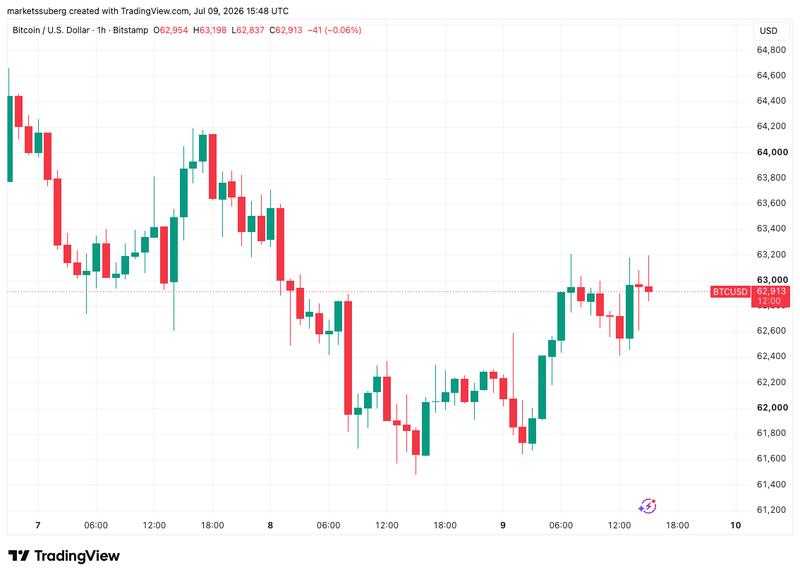
Equity markets in the United States posted gains across all major indices, successfully reversing Wednesday's losses following US President Donald Trump's declaration that the Iranian peace agreement was "over."
"They called a little while ago; they want to make a deal so badly," Trump later stated in remarks cited by trading intelligence platform The Kobeissi Letter along with other sources.
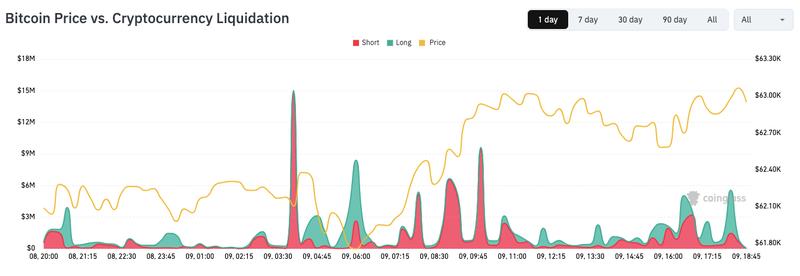
Digital asset markets mirrored this optimistic sentiment, contributing to 24-hour short position liquidations reaching approximately $100 million, according to statistics from CoinGlass.
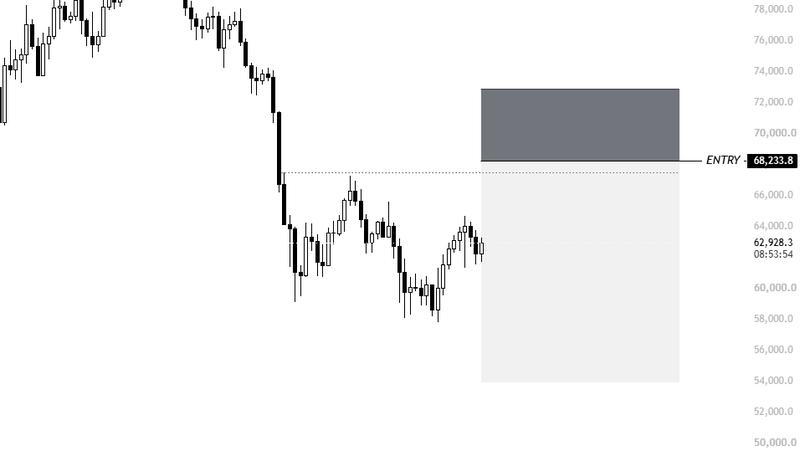
Offering perspective on the current BTC price structure, market participant Killa characterized their outlook as "not bearish at all."
"In my view, we still have a few more months of choppy PA," a post on X indicated, identifying $68,000 as a possible level for entering short positions.
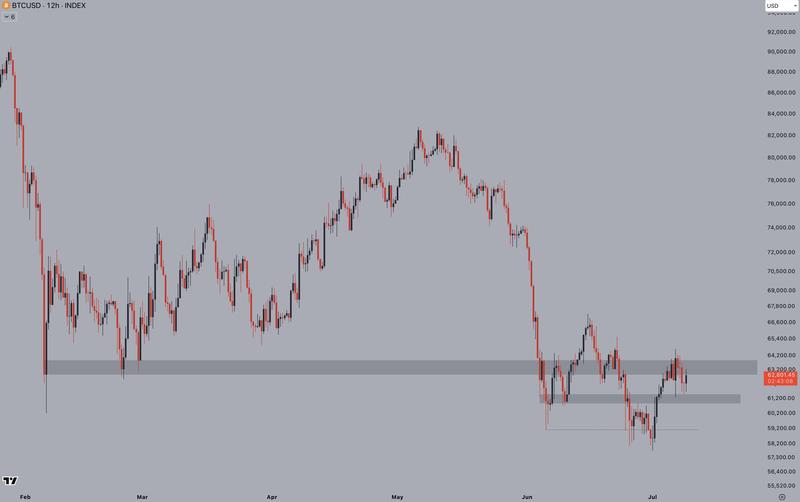
Another market observer, trader Jelle, identified persistent bullish momentum, suggesting that support level reclamation remains achievable.
"Looks like bulls aren't giving up on the reclaim just yet," he communicated to his X audience.
"Get back above, and we likely push for 65-70k again. Reject, and sub-60k is back on the menu for $BTC."
Daily candle close at $64,700 critical for Bitcoin price trajectory
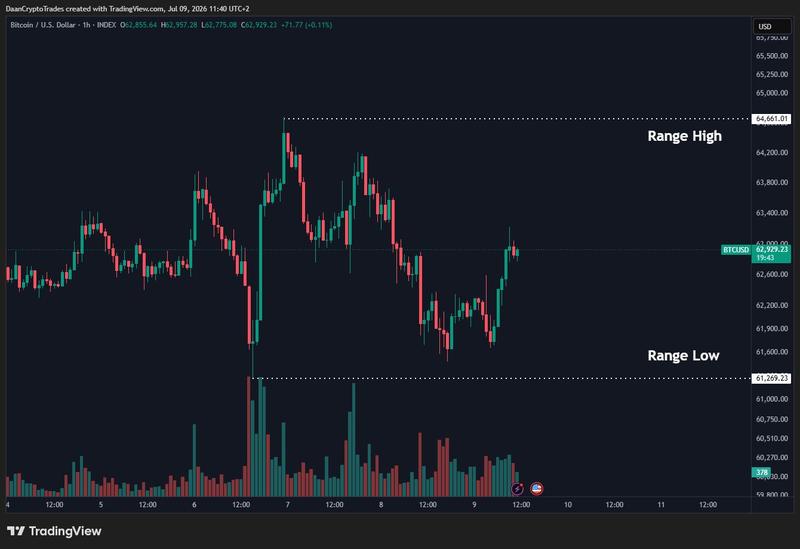
Meanwhile, market analyst Daan Crypto Trades highlighted the significance of a $64,700 daily closing level.
"$BTC is ranging $61.3K-$64.7K range and spent this morning climbing back up after yesterday's risk-off flush," his most recent X market assessment stated.
"A daily close above $64.7K flips the story and would make for a larger relief rally across the board. A close under $61.3K opens the road to the lows again and kills the momentum."
According to previous Cointelegraph coverage, market perspectives regarding whether the bear-market bottom has been established remain divided among analysts.
During this week, technical analysis outlined a "textbook" bottoming pattern currently taking shape, whereas BTC price-cycle historical comparisons suggested the possibility of a more substantial macro-level floor ahead.