BTC Approaches $80K Monthly Peak as Bullish Signals Dominate Price Indicators
As Bitcoin nears the $80,000 threshold, futures market data reveals strategic trader positioning. Could selling pressure between $83,000 and $88,000 halt the upward momentum?

On Wednesday, Bitcoin (BTC) climbed to a monthly peak of $79,472, representing its most robust 28-day performance since April 2025. This upward movement corresponds with a transformation in market positioning indicators and an increase in leverage utilization.
When examining market positioning metrics alongside open interest data together, evidence emerges that fresh positions are being established, which may be driving BTC's advance toward unprecedented levels.
Rising Leverage Accompanies BTC Positioning Growth
According to Bitcoin researcher Axel Adler Jr., the Bitcoin positioning index has demonstrated upward movement, with its 30-day moving average climbing to 4.5 from a February reading of -10.9. This composite indicator incorporates net taker flow direction, open interest movements, funding rates, and exchange balance data into one unified metric.
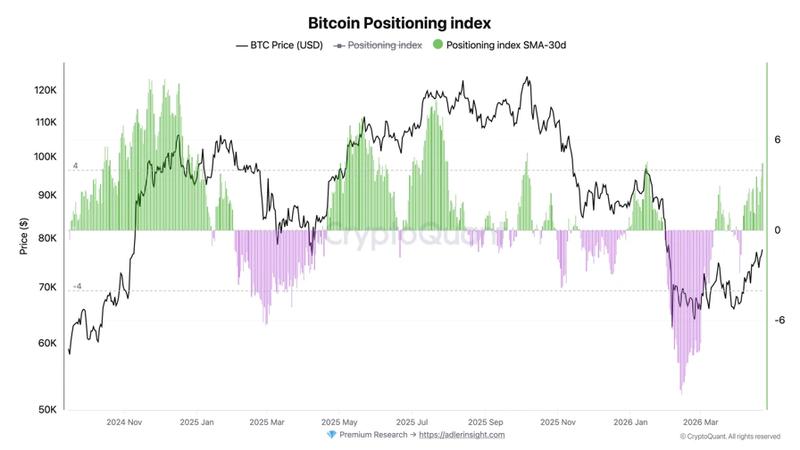
The indicator's continuous rise beginning in late March, advancing from 0.4 to present readings, demonstrates sustained enhancement without disrupting the underlying price trajectory.
Open interest expansion validates this identical pattern. The 30-day percentage change registers at +14.5%, featuring 23 out of the previous 30 trading sessions ending in positive territory. The combination of increasing positioning metrics and expanding open interest points to fresh capital flowing into derivatives trading venues.
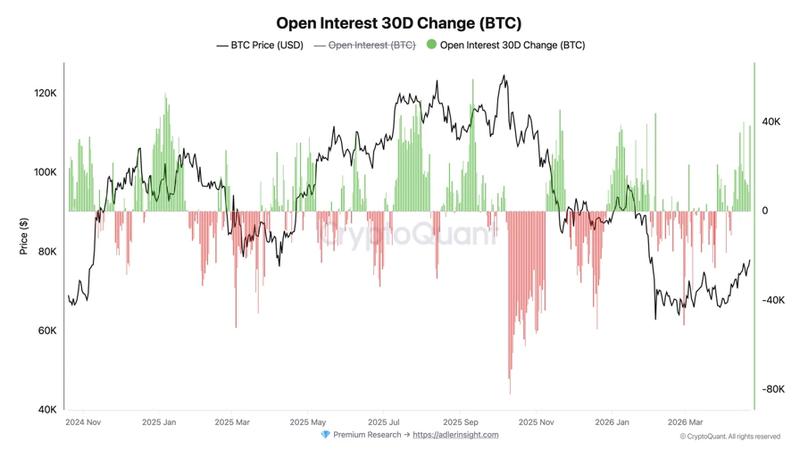
Throughout the most recent 24-hour period, combined open interest increased by 6.7% reaching 260,000 BTC, whereas leverage experienced a 10.7% decline during the weekend, indicating recent position reduction prior to the current positioning accumulation.
Critical BTC Price Levels Under Observation
Bitcoin has successfully broken above a downward-sloping trendline originating from the October 2025 high near $126,000 and has recaptured the 100-day exponential moving average (EMA). This development points to a significant trend reversal from bearish sentiment to neutral-to-bullish conditions on extended timeframes.
The $81,000 price point currently represents the initial testing zone, featuring a minor fair-value gap that suggests a liquidity disparity, where maintaining price stability would demonstrate buyer acceptance of elevated valuations.
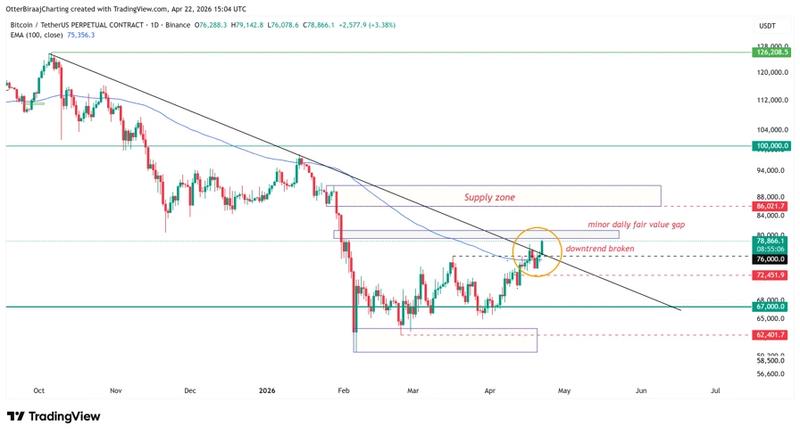
Beyond this threshold, $88,000 represents the resistance zone connected to previous distribution activity. The $88,000–$91,000 band emerges as a critical supply area, formed during an earlier distribution phase where substantial Bitcoin volumes previously exchanged ownership.
A significant portion of these position holders currently find themselves approaching break-even or modest profitability, which generally triggers heightened market activity when prices return to these levels.
Compounding this dynamic, the realized price for the three–to-six–month holder group rests at $91,600, providing additional confirmation of this zone's importance as a pivotal decision threshold.
A continuation of upward price movement through this range would indicate robust demand conditions, demonstrating that purchasing activity is successfully absorbing the available overhead supply and establishing conditions for Bitcoin price appreciation.
Cryptocurrency analyst Crazzyblockk identified a narrow trading range, where the $72,000–$75,000 area functions as support, underpinned by concentrations of realized prices from intermediate-term holders. A decline beneath this support band would force additional supply into unrealized losses, elevating the potential for responsive selling pressure.
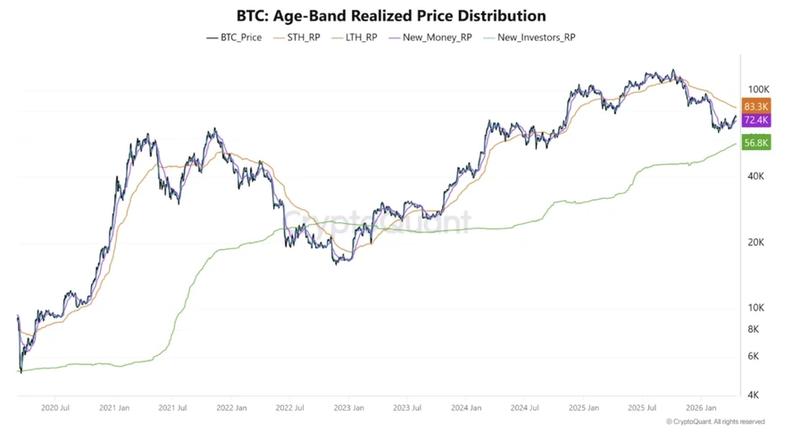
On the resistance side, the $83,000–$85,000 range identifies as a profit-realization zone for newer short-term position holders. Sustained price strength penetrating this area would confirm that buyer demand is successfully absorbing the available supply, facilitating momentum expansion.