$69K Bitcoin Target Emerges as Crude Oil Crashes: Five Critical Bitcoin Developments This Week
BTC traders set sights on $69,000 price level this week following US-Iran diplomatic breakthrough that triggers bullish momentum as crude oil falls beneath $80 threshold.

The third week of June begins with Bitcoin (BTC) gaining positive momentum following a US-Iran diplomatic agreement that pushes risk assets into higher territory.
Key points:
- BTC price movement sets sights on $66,000 while US equity futures climb and crude oil reaches its lowest point since early March.
- Market participants identify $69,000 as a probable near-term BTC price objective.
- Federal Reserve's interest-rate determination faces heightened scrutiny following Kevin Warsh's appointment as new Chair.
- Large Bitcoin holders have shifted away from selling behavior, establishing a "rock-solid floor" around $60,000.
- Weakening overall demand creates uncertainty regarding bull-market recovery prospects.
Crude oil slides beneath $80 threshold as Iran diplomatic agreement nears completion
This week, market participants focus intensely on the evolving US-Iran situation as a diplomatic resolution appears increasingly imminent.
Weekend developments initially pointed to a Sunday signing deadline for the ceasefire agreement, though this timeline was later adjusted to Friday.
Various sources subsequently verified that both nations would execute an agreement establishing a 60-day cessation of hostilities, alongside additional provisions, scheduled for signing in Switzerland on Friday.
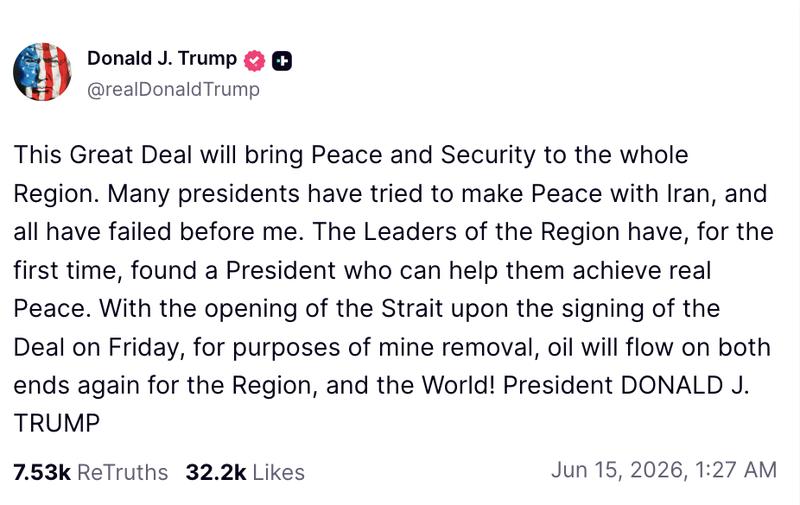
Through a Truth Social post, President Donald Trump verified the agreement would incorporate the reopening of the Strait of Hormuz — a critical waterway for global petroleum transport.
"With the opening of the Strait upon the signing of the Deal on Friday, for purposes of mine removal, oil will flow on both ends again for the Region, and the World!" his statement read.
Equity futures in the US experienced significant gains in response, while risk assets broadly advanced higher — Bitcoin and cryptocurrency markets included.
Conversely, petroleum prices dropped sharply, as WTI crude descended below the $80 per barrel mark for the first occurrence since mid-April.

In response, Danny Dayan, a portfolio manager, characterized the diplomatic deal as the "biggest and worst TACO of all time," referencing the Trump administration's methodology toward multiple geopolitical and macroeconomic challenges.
"Overheat, higher core inflation, and higher neutral rate, will be the macro considerations ahead," he communicated to X followers, anticipating a shift away from petroleum as a primary market influencer.
During the entire conflict period, elevated oil prices have created resistance for Bitcoin, even while equity markets achieve consecutive record highs.
BTC/USD currently trades at the identical price point it held when hostilities commenced on Feb. 28.
Market participants anticipate $69,000 short squeeze scenario
The announcement of a US-Iran diplomatic resolution catalyzed BTC price movement toward two-week peak levels heading into Sunday's weekly candle closure.
TradingView data recorded localized peaks at $65,988 as the fresh trading week commenced.
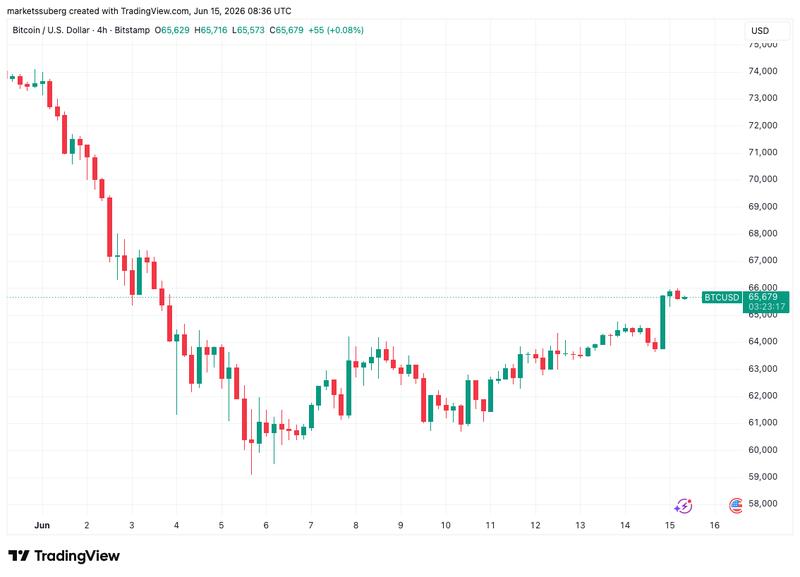
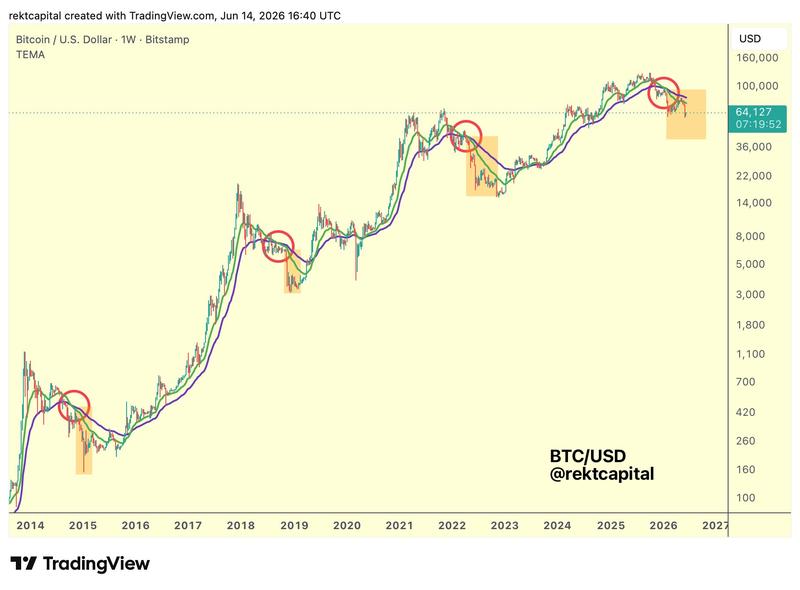
Given that both the $60,000 threshold and Bitcoin's 200-week simple moving average (SMA) at $62,000 maintained their support function, market participants' near-term perspective started improving.
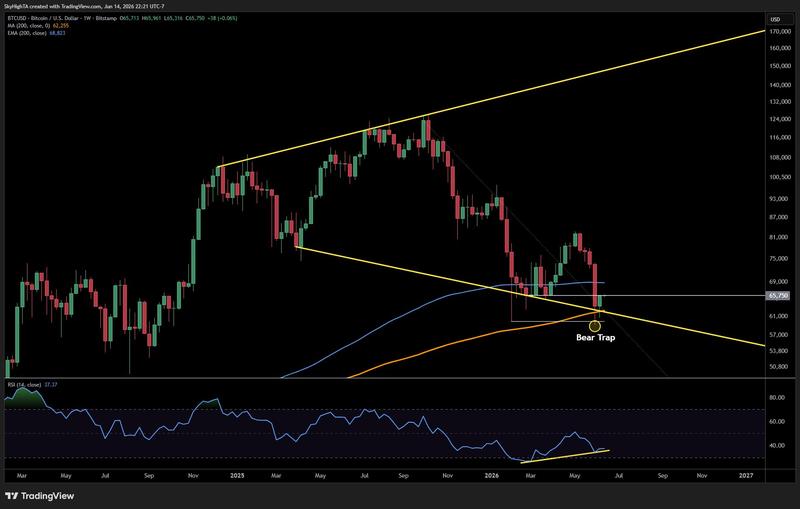
"Closed near the highs with almost no upper wick, favoring a push higher this week," trader SuperBro communicated in his most recent X analysis.
SuperBro identified the 200-week exponential moving average (EMA) as a potential objective for compressed short positions.
"There are a lot of leveraged shorts up to the 200 EMA around $69K. Good chance that is where this is headed," he continued.
"Q2 closes in just 2 weeks. Let's see if bulls can keep the heat on."
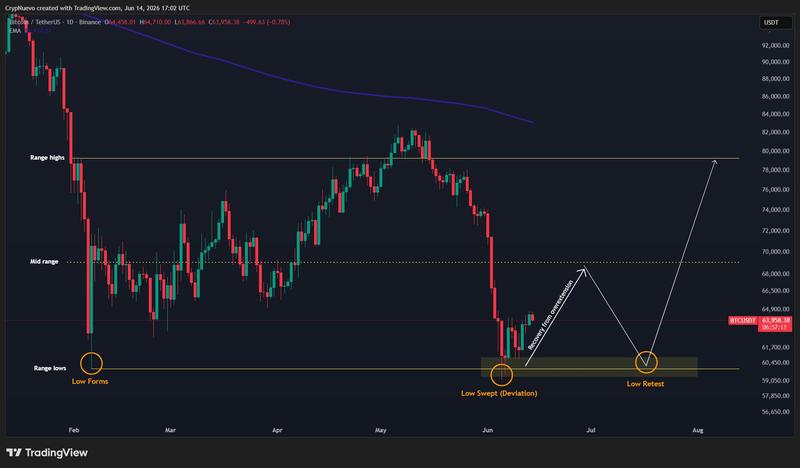
Market analyst CrypNuevo similarly targeted the territory immediately beneath the $70,000 level for the upcoming week.
"Still seeing a recovery to the mid-range $69k," his X analysis stated.
CrypNuevo cautioned that BTC/USD might still revisit recent lows within range-bound price movement.
Analyst and trader Rekt Capital concurred, emphasizing that price recoveries typically weaken as bear markets advance, alongside critical support levels — specifically the $60,000 threshold in this instance.
Federal Reserve's new chairman confronts rate reduction pressure
Despite substantial geopolitical volatility, "all eyes" continue focusing on the United States Federal Reserve.
Wednesday brings the Fed's new chairman, Kevin Warsh, to his inaugural meeting for determining interest-rate adjustments.
Considering the inflationary pressure generated by the Iran conflict, financial markets perceive minimal probability of Warsh reducing rates — yet Trump has persistently advocated for precisely this action.
During an April interview, Trump informed mainstream media outlets he "would" experience disappointment should Warsh fail to implement a reduction at the earliest opportunity.
"All eyes are on the Fed this week," trading resource The Kobeissi Letter summarized in its recent X analysis.
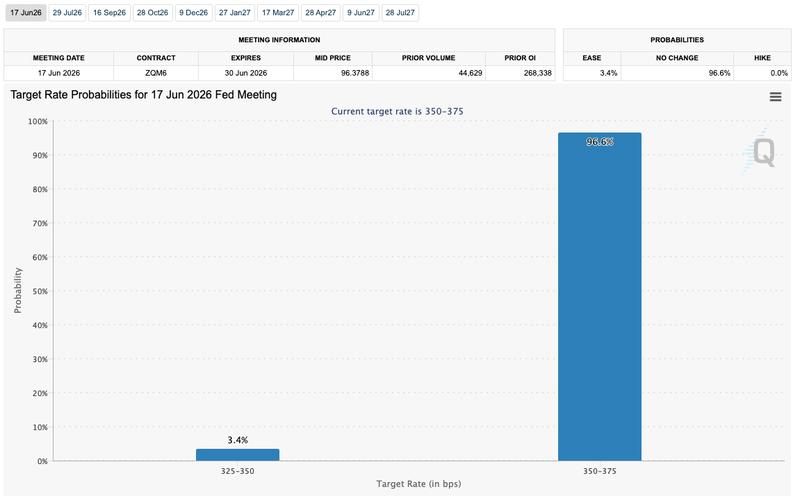
Current data from CME Group's FedWatch Tool establishes the likelihood of a minimal 0.25% reduction at merely 3.4%.
In response, market commentators predominantly anticipate rates maintaining present levels.
In Sunday analysis, Dayan characterized Warsh as "trapped no matter what he does."
"If he is hawkish, he will be breaking promises made to Trump," he stated.
"On the other hand, if he uses the recent decline in oil prices as a reason for a wait and see stance, I think he is raising the odds we will see a panic hike in the second half of the year as the economy overheats."
American markets will operate on a condensed four-day schedule, given Wall Street's closure Friday observing the Juneteenth holiday.
Large holders establish "rock-solid floor" through buying activity
Providing encouragement to Bitcoin bulls, fresh analysis discloses a potential fundamental shift in large-volume investor behavior during recent trading days.
According to onchain analytics platform CryptoQuant, Bitcoin whales have transitioned back to accumulation mode.
Examining exchange inflows originating from whale wallets, CryptoQuant data demonstrates that coin days destroyed (CDD) — representing the duration funds remained dormant following their last transaction — have substantially decreased.
"Inflow CDD plunged from 2.16M to near-zero (33K), showing long-term whale dumping has completely stopped," contributor Woo Minkyu communicated in a Monday Quicktake blog post.
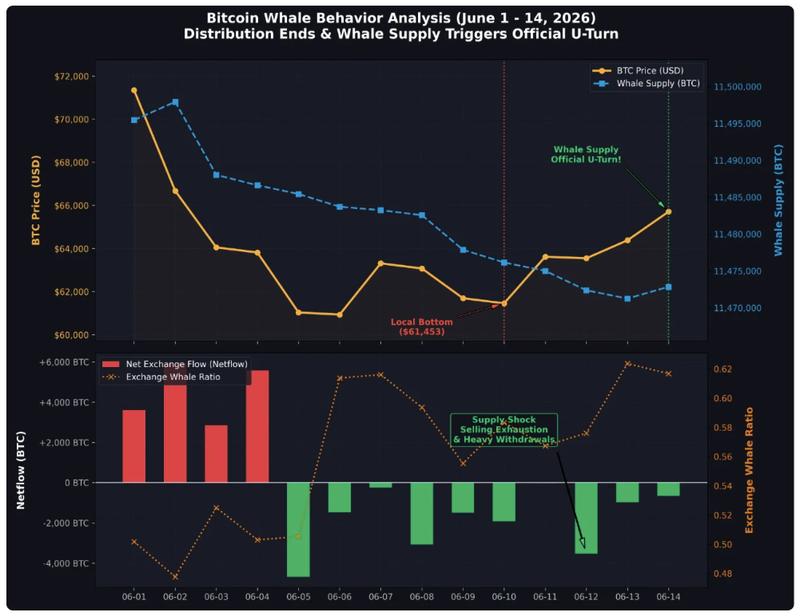
Woo characterized whales as executing an "aggressive bottom buy" near $61,000, absorbing "all" coins liquidated through panic selling by alternative investor groups.
"The wealth transfer from weak hands to strong hands is complete," his conclusion stated.
"Whales have locked in the $60,000–$61,500 range as a rock-solid floor. With exchange reserves depleted, the path of least resistance for Bitcoin is now firmly upward."
Previously, Cointelegraph documented that three essential conditions for a BTC price recovery were approaching satisfaction. Analysis indicated at that juncture that whales on Hyperliquid and Bitfinex had already positioned themselves anticipating a bounce.
Bitcoin apparent demand maintains negative territory
Regarding complete bull-market recovery prospects, CryptoQuant maintains a cautious stance considering present onchain metrics.
Apparent demand, as contributor XWIN Japan observes, continues registering negative values — a condition that has historically corresponded with bear markets throughout Bitcoin's history.
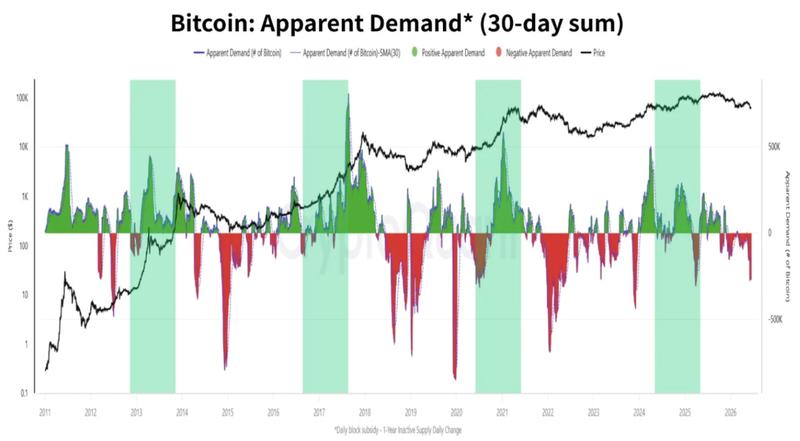
Apparent demand represents the differential between Bitcoin's issuance — meaning newly mined coins — and the supply remaining inactive exceeding one year.
"If the decrease in inventory exceeds production, demand is increasing, and vice versa," explains Julio Moreno, CryptoQuant's head of research.
Consequently, current negative readings indicate widespread lack of interest in BTC exposure and might potentially supersede the four-year cycle hypothesis in determining future price trajectory, according to XWIN.
"This suggests that Bitcoin may not be declining simply because 'the cycle says so.' Instead, demand growth has slowed," its weekend analysis stated.
XWIN additionally highlighted declining open interest across Bitcoin futures markets while reinforcing the hypothesis that a concluding "capitulation" event might still materialize.