XRP Faces Potential 50% Plunge Even as Goldman Sachs Holds $152M in ETF Positions
Investment giant Goldman Sachs disclosed $152 million in spot XRP ETF holdings, even as volatility metrics reach levels historically associated with major price movements.

Following a 3.5% pullback over the past 24 hours, XRP (XRP) changed hands at $1.37, showing little reaction to Goldman Sachs' announcement of its positions in spot XRP exchange-traded funds (ETFs).
Though the disclosure signals sustained institutional interest for the long haul, it arrives during a period of uncertain risk appetite and a technical breakdown from a bearish pattern.
Key takeaways:
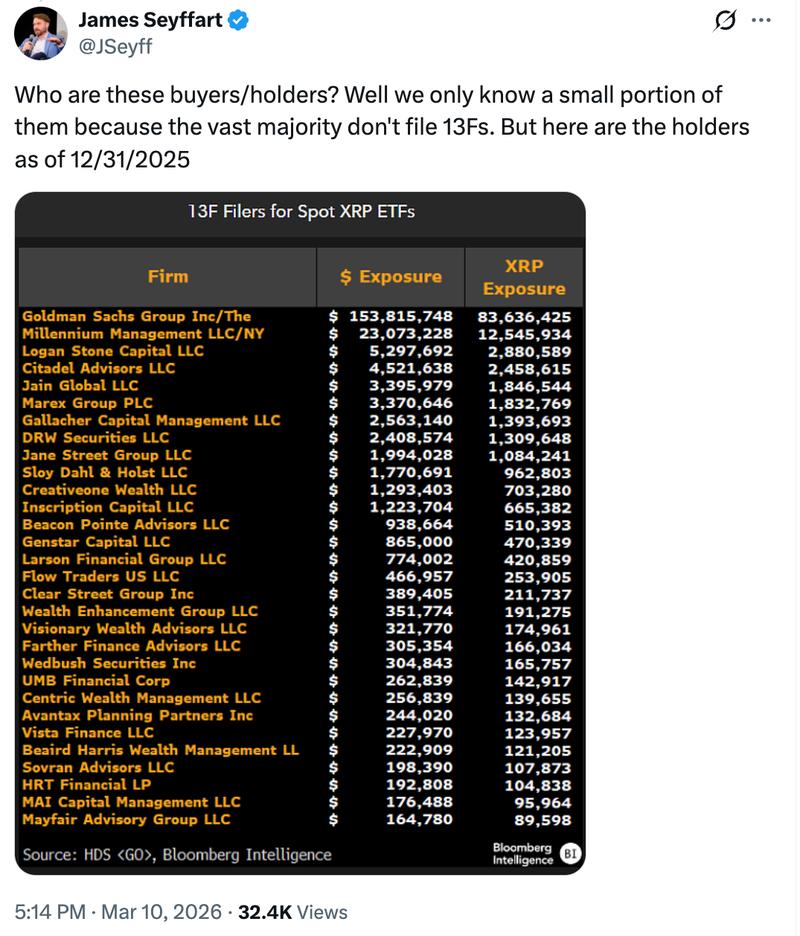
- Investment bank Goldman Sachs reported holding $152.17 million across four spot XRP ETFs, positioning itself as the leading institutional investor in this category.
- The cryptocurrency continues to follow a bear pennant breakdown pattern with a projected downside target of $0.72.
Goldman Sachs reports $152 million in XRP ETF holdings
In its Q4 2025 13F filing submitted to the SEC, Goldman Sachs disclosed itself as the top institutional holder of US spot XRP ETFs with a $152 million stake.
The asset manager, overseeing $3.5 trillion in assets, has distributed its holdings among four different funds: $39.8 million in Bitwise XRP ETF, $38.5 million in Franklin XRP Trust, $38 million in Grayscale XRP ETF, and $35.9 million in 21Shares XRP ETF.
The Wall Street giant isn't operating in isolation. According to Bloomberg Senior ETF analyst James Seyffart, Goldman's position represents approximately 73% of the roughly $211 million controlled by the leading 30 institutional players in XRP ETFs.
Despite this institutional commitment signaling long-term conviction, the XRP price sits 25% beneath its yearly opening level near $1.84, weighed down by decelerating ETF capital flows and broader macroeconomic challenges.
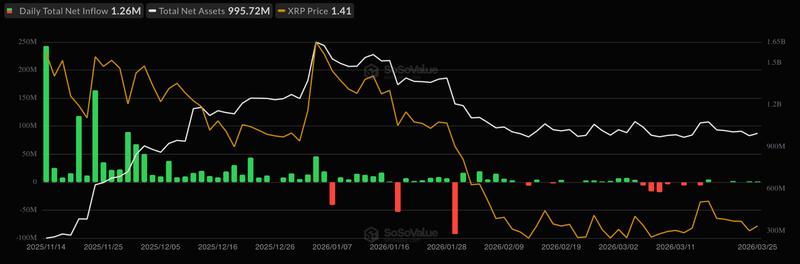
Net cumulative inflows for US-based XRP ETFs surpassed the $1 billion threshold during their initial months of operation, reaching a high of $1.28 billion on Jan. 16. The momentum has subsequently moderated to $1.21 billion as of today.
Total assets under management hit their apex around $1.65 billion in early January before declining to approximately $995 billion, impacted by XRP's falling price and a period of net capital withdrawals, based on data compiled by SoSoValue.
Between March 3 and March 16, XRP ETFs experienced combined net outflows totaling $56.5 million. Following that period, daily inflows have remained subdued, staying under $5 million.
Bear pennant breakdown gains momentum for XRP
On Thursday, XRP price pierced below the lower boundary of its ongoing bear pennant formation when it fell beneath the pattern's support trend line at $1.40. A potential retest of this lower trend line as fresh resistance could validate the breakdown.
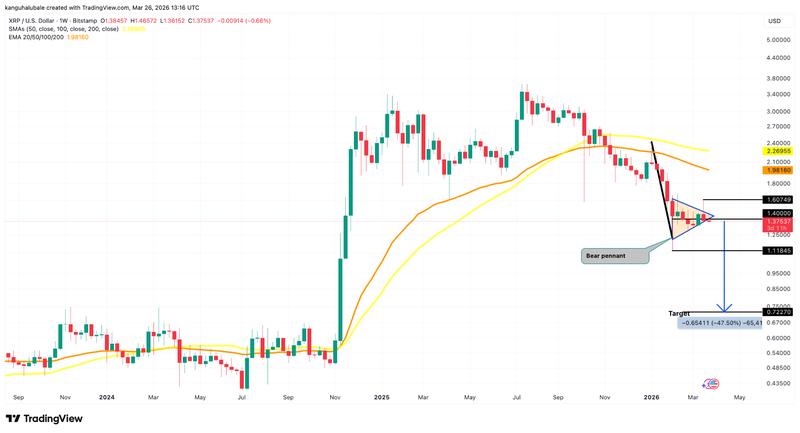
Bear pennants develop when the price undergoes consolidation within a triangle pattern after experiencing a sharp decline. When the price penetrates below this triangular formation, it typically initiates another substantial downward movement.
In XRP's case, the technical target derived from the bear pennant pattern sits at $0.72, representing approximately 48% downside from current trading levels.
According to previous Cointelegraph analysis, a decline below $1.27 would indicate continued bearish dominance, potentially accelerating XRP/USD's descent toward the $1 level.
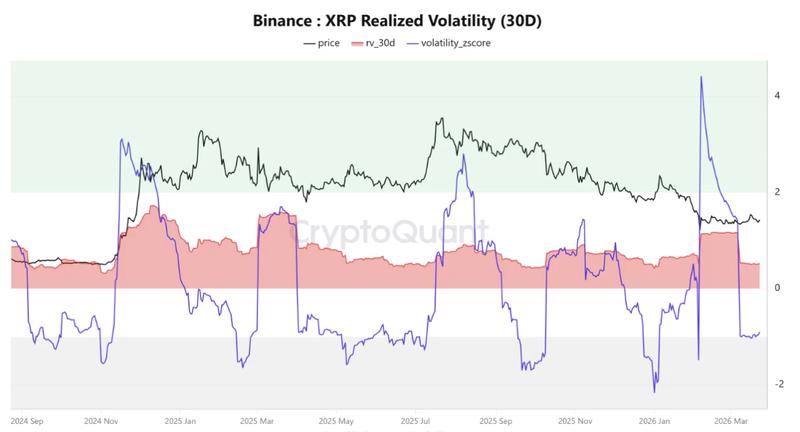
Compressed XRP volatility signals incoming "sharp" price action
Volatility indicators for XRP are flashing warnings of an approaching significant price swing.
The 30-day Realized Volatility (RV 30D) has contracted to approximately 0.5266, representing the year's lowest reading for 2026.
At the same time, the Volatility Z-Score stands at -0.9048, "reflecting a clear decline in volatility compared to the historical average," according to CryptoQuant analyst Arab Chain in a recent Quicktake note, adding:
"This type of volatility contraction is commonly referred to as volatility compression, a phase that often precedes a sharp price movement in either direction."