BTC Technical Indicators Signal Bullish Momentum as $78K Becomes Critical Resistance Level
Bitcoin appears to have established $75,000 as a new support level, with two traditional technical indicators suggesting an imminent BTC price surge could be on the horizon.

The price of Bitcoin (BTC) has staged an impressive 25% rebound from its multi-year bottom beneath the $60,000 threshold, while key momentum indicators are displaying uncommon "buy" signals.
Key takeaways:
- Bitcoin's MACD and RSI indicators forecast a sharp BTC price rally in the coming days.
- Bitcoin price must reclaim $78,000 in the coming days to sustain upward momentum.
Bitcoin's MACD, RSI confirm "bull market is on"
Information from TradingView revealed BTC/USD exchanging hands at $75,300, sitting 4% underneath its 10-week peak of $78,380 that was achieved on Friday.
Notwithstanding this recent retreat, driven by uncertainty surrounding the United States and Israel-Iran conflict, technical price indicators suggested additional upside potential lies ahead.
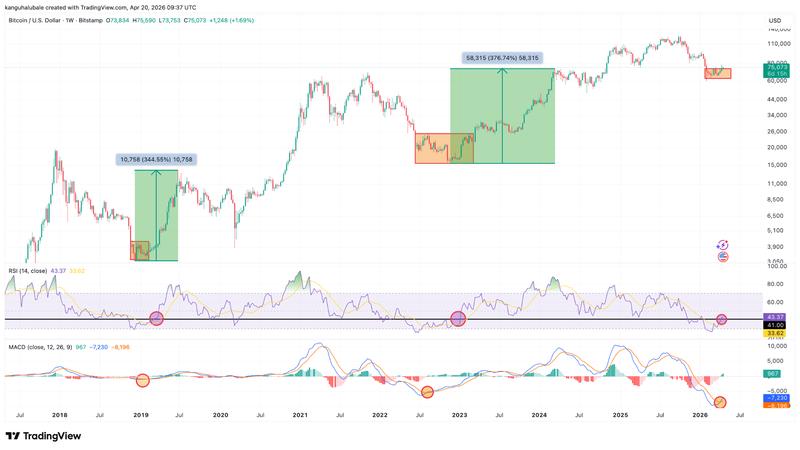
Examining the moving average convergence divergence (MACD) indicator on the weekly timeframe, trader Sykodelic identified a significant bullish crossover, positioning Bitcoin for an upward trajectory.
"Not only do we have a 1W MACD bullish cross and break of trend, we have it from the lowest point the MACD has ever dropped to," analyst Sykodelic said in a recent post on X, adding:
"We are at a very important level here, and the weekly close will be very important."
Historical patterns demonstrate that Bitcoin typically experiences sharp increases when the MACD line (blue) moves above the signal line (orange).
This pattern ultimately resulted in 340%-380% BTC price increases, as evidenced in 2018-2019 and 2022-2023.
"A big move usually follows whenever this weekly MACD bullish cross happens," analyst Mikybull Crypto said in a recent post on X.
Concurrently, the relative strength index, or RSI, has climbed back to 43 from a low of 21 recorded in mid-February. When paired with a buy signal from the MACD, the technical setup starts to mirror characteristics of earlier cycles.
In a recent video posted on X, trading resource Material Indicators said that the weekly RSI holding above the 41 level was among the "macro things that need to happen to say a validated bull market is on."
Historical instances in 2023, 2020 and 2019 have led to 660%, 1,600% and 316% BTC price rallies, respectively.
Additional Bitcoin analysts propose that persistent spot market buying volume and regular inflows into the Bitcoin ETFs are the essential elements needed for a rally toward new all-time highs.
Bitcoin must reclaim $78,000 next
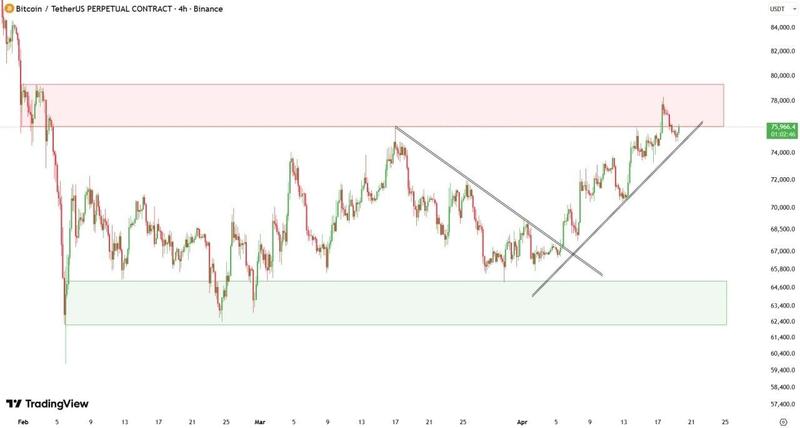
As Cointelegraph reported, Bitcoin's bullish case hinges on flipping the resistance at $78,000 into support, where the true market mean currently sits.
Evaluating Bitcoin's price movement on shorter time frames, Telegram trading resource Technical Crypto Analyst said that after reclaiming the $70,000 level, the BTC/USD pair is "now pushing into a major supply zone around 75K–78K, which is acting as resistance," adding:
"A clean breakout above this zone could continue the move toward new highs, while rejection may lead to a pullback toward the 68K–70K support region."
Fellow analyst Bitcoinsensus said failure to break above $78,000 would suggest that the latest rally was a "possible bull trap," as seen in previous failed breakouts.
"If price loses momentum from here, the setup keeps downside pressure in focus in the near term."
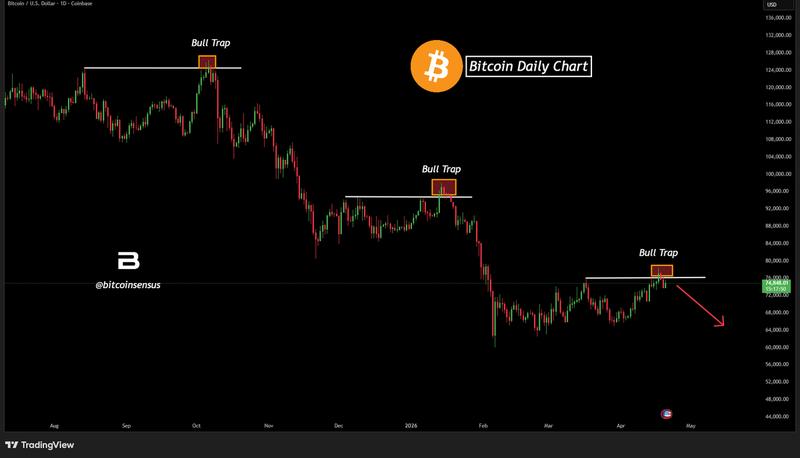
As Cointelegraph reported, a close above the $76,000-$78,000 area would confirm that the buyers are in control, clearing the path for a potential rally to $84,000.