BTC Price Warning Emerges as 'Overbought' Indicators Point to Potential Correction Near $78K
A 36% surge from the $60,000 level has pushed Bitcoin's relative strength index into territory that signals a possible top formation, a pattern not observed since the beginning of 2026.

Market participants trading Bitcoin (BTC) are anticipating a near-term pullback as a critical indicator measuring BTC price momentum climbs to its most elevated reading in nearly fifteen weeks.
Key takeaways:
- Historically, Bitcoin's "overbought" RSI readings have been followed by notable price corrections.
- A breakdown beneath the $78,000 support zone could trigger a short-term decline in Bitcoin's price.
Technical indicators point to "overheated" BTC price conditions
The 36% surge that propelled Bitcoin to $82,800 on Wednesday from its macro bottom at $60,000 has produced a substantial effect on its daily RSI reading.
The daily chart reveals that the RSI climbed to 70 on Wednesday, up from local bottoms of 39 recorded in March.
"$BTC's daily RSI went overbought right as we tagged the 200-day EMA," trader Jelle said in a Friday post on X, adding:
"It makes sense to find resistance here."
The RSI indicator gauges trend momentum and features three critical thresholds that market watchers monitor: the oversold boundary at 30, the neutral midpoint at 50, and the overbought threshold at 70.
As prices breach these thresholds in either direction, market participants can draw conclusions regarding the trajectory of the prevailing trend. Following upward price movements, BTC typically experiences corrections when the RSI penetrates the overbought zone.
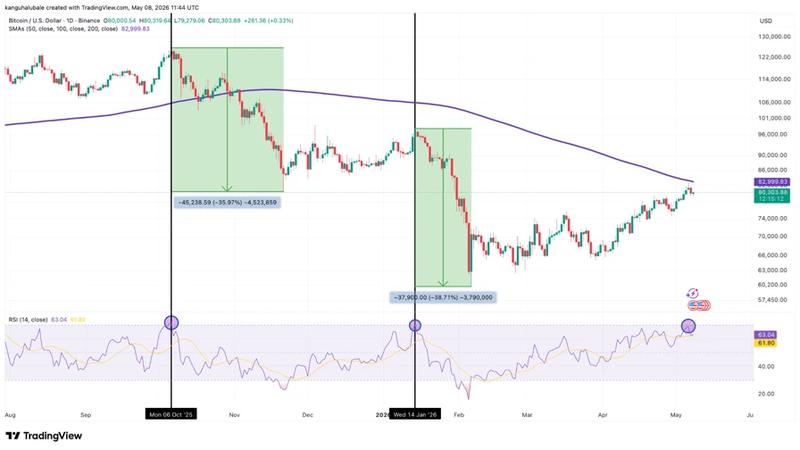
Analyst Crypto Tice said this is a "rare" signal that has occurred only four times over the last year, with every occurrence leading to a "short-term pullback," adding:
"Overbought conditions on the daily don't resolve sideways. They resolve with a flush."
Fellow analyst Rekt Fencer pointed out that the "last 2 times this happened, it dumped" 35%-38%, as shown in the chart above.
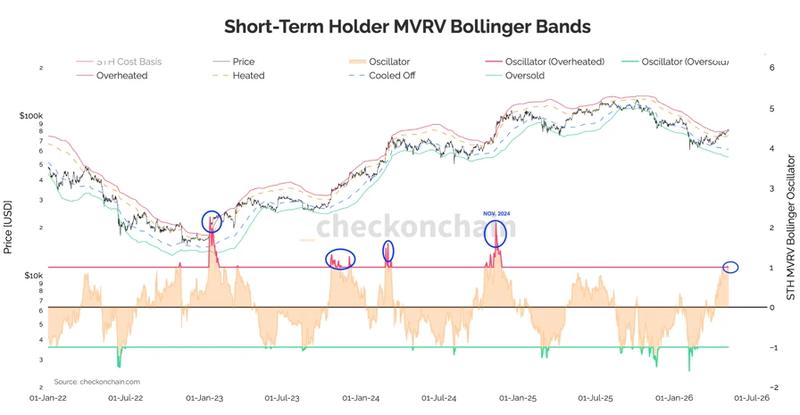
Additionally, Bitcoin's market value to realized value (MVRV) ratio, an indicator that assesses whether the digital asset is trading above fair value, has recently moved into the "overheated" zone.
"Bitcoin breaks above the overheated level on the short-term holder Bollinger Bands for the first time since November 2024," analyst FrankAFetter said in a recent post on X.
The previous instance when it reached comparable levels was in November 2024, which preceded a 15% BTC price drop.
The $78,000 level emerges as critical Bitcoin support zone for BTC price action
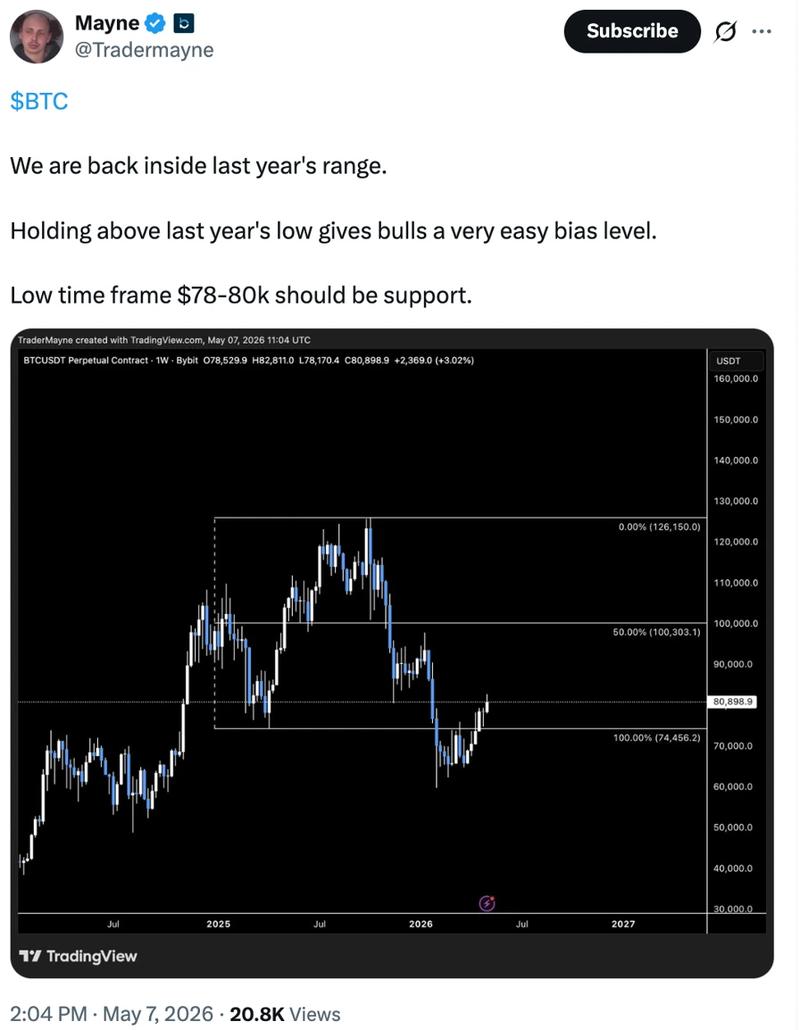
Market analysts trading Bitcoin have reached consensus that $78,000 now represents a crucial support zone for BTC/USD.
The 200-day exponential moving average positioned at $83,000 is functioning as a resistance barrier, while the "first main area of interest sits at $78,000," analyst Jelle said in an X post on Friday, adding:
"Turn that into support and we can have another go at the MAs."
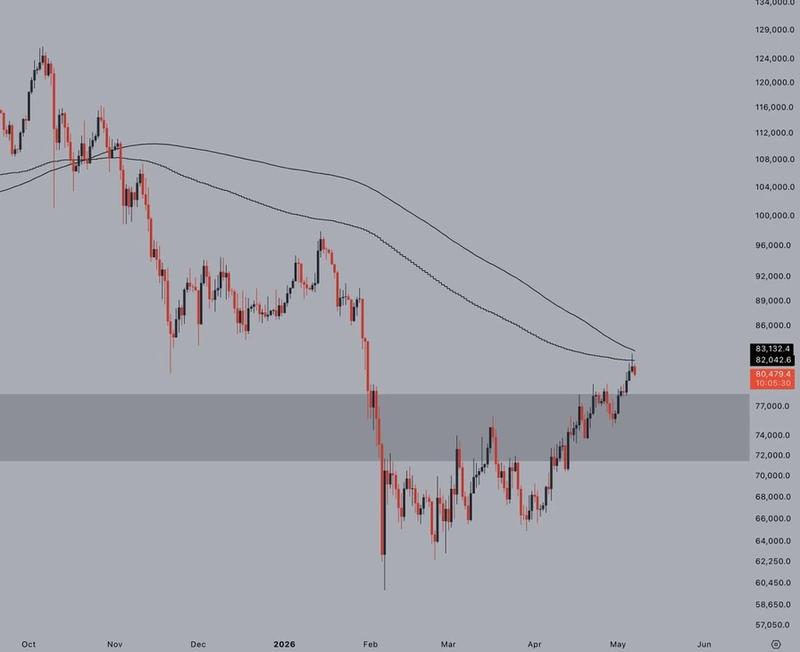
Fellow analyst Tradermayne said holding the support at $78,000-$80,000 on low time frames would give "bulls a very easy bias level."
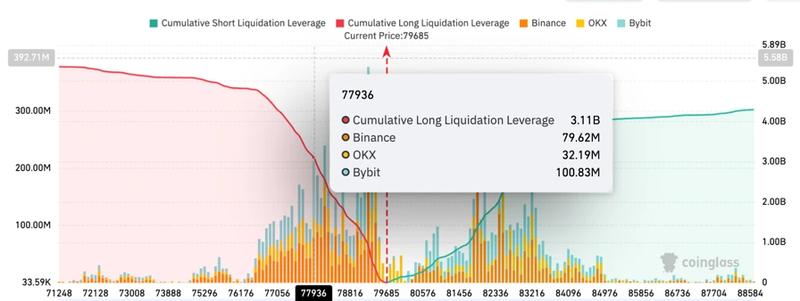
Trading orders are positioned on both sides of the current spot price, with analyst Master of Crypto seeing the likelihood of these liquidity clusters being taken out.
"$BTC is holding around the $78.5K–$79.1K support zone," the analyst said in a Friday post on X, adding:
"If buyers defend this area, the next move could be toward $82K–$83K where a lot of liquidity is sitting. But if this support breaks, Bitcoin could quickly drop to $75K–$76K."
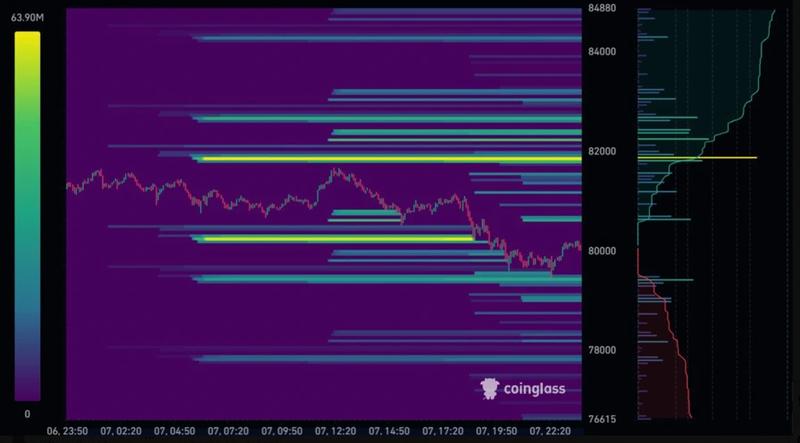
Data from the Bitcoin liquidity map indicates that a price correction dropping below $78,000 would set off more than $3.1 billion worth of leveraged long liquidations across all exchanges.