BTC Drops Under $82K Following Tesla's Q3 Report and KOSPI Decline
The leading cryptocurrency pulled back from its approach to $85,000 following Tesla's announcement of Q3 capital expenditure figures that fell short of market expectations.

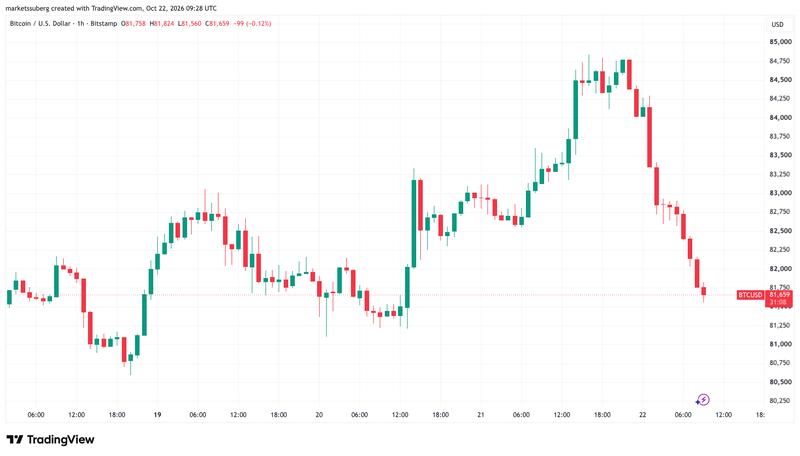
The price of Bitcoin (BTC) experienced a decline of close to 3% on Thursday following a failed attempt to breach the $85,000 level.
Key points:
- The cryptocurrency retreated to approximately $81,500 following Tesla's disclosure of Q3 capital expenditure (capex) totaling $4.73 billion, which came in below analyst expectations.
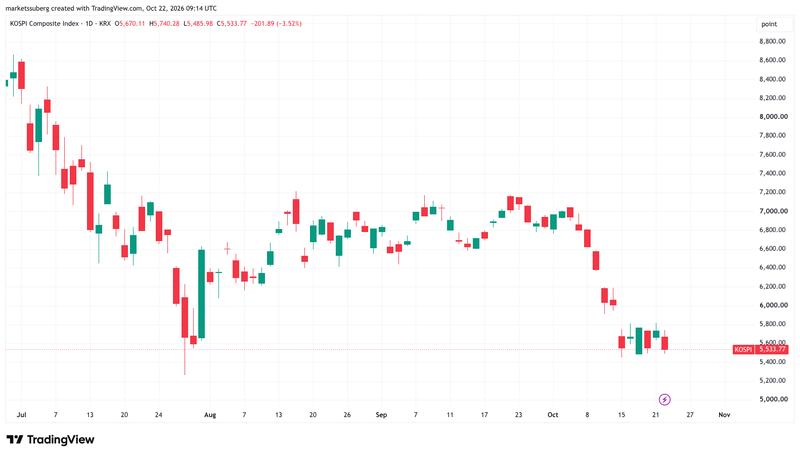
- The KOSPI Composite Index in South Korea experienced renewed selling pressure, ending Thursday's session with a 3.5% decline.
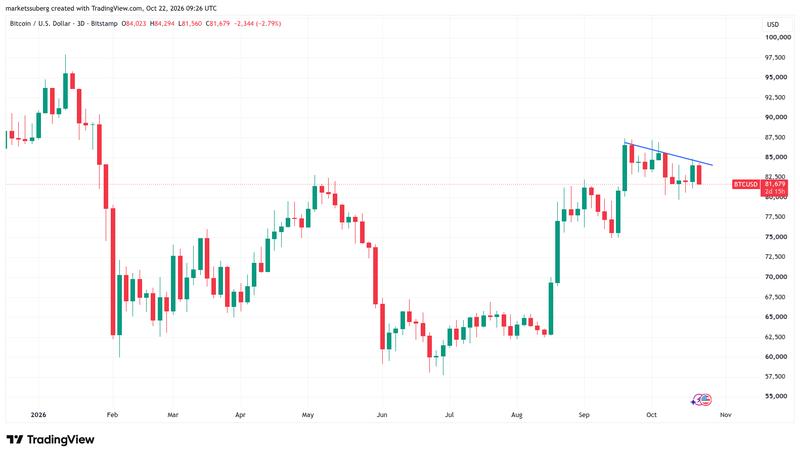
- The BTC price movement encountered rejection at a resistance trend line positioned at $84,840, maintaining a pattern characterized by lower highs.
Questions emerge over Tesla's lower-than-anticipated capex
According to data from TradingView, BTC/USD pulled back to levels near Wednesday's daily close, falling back beneath the $82,000 threshold. The trading pair surrendered all of the advances achieved during that session, when the price reached approximately $84,840 on the Bitstamp exchange.
Better-than-anticipated corporate earnings from US companies had contributed to igniting a bullish move across both cryptocurrency and equity markets. Nevertheless, Tesla's earnings report released following the conclusion of Wall Street's trading session failed to deliver the same optimistic indicators that SpaceX and General Motors had provided earlier during the week.
Tesla disclosed Q3 revenue totaling $28.05 billion, falling marginally short of the $28.13 billion forecast from Bloomberg. Capital expenditure, however, registered at $4.73 billion, significantly below the anticipated $7.96 billion. These capex figures seemed to intensify worries regarding the AI sector as markets attempted to bounce back from the previous week's technology stock selloff in Asian markets.
"Lower capex suggests less of an 'all-in' approach to the AI arms race than one would expect from Elon,"
Ryan Lee, senior vice president of product and strategy at Direxion, told Reuters
During the company's quarterly earnings call, Musk indicated that expenditure levels would increase extending through 2028.
"I think capex is actually ending up being a little lower than we anticipated, but we'll start to become more meaningful next year. And then noticeable in the tens of billions in '28,"
Elon Musk, quoted by Bloomberg
The technology-focused KOSPI Composite Index in South Korea concluded Thursday's trading down 3.52%, finding it difficult to maintain a rebound after plunging to 5,460 points during the previous week, marking its weakest level since the end of July.
BTC establishes lower high as resistance trend line remains intact
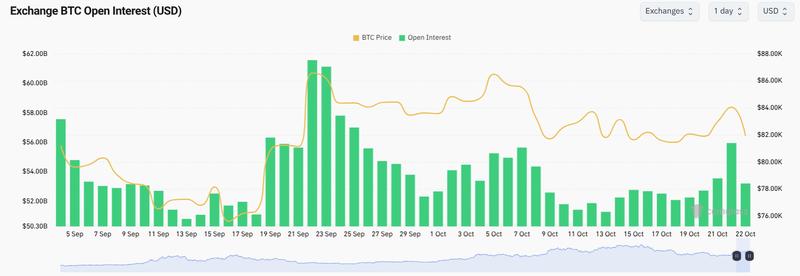
Blockchain data revealed a substantial uptick in open interest (OI) throughout cryptocurrency exchanges in the period leading up to Bitcoin's price reversal.
Open interest climbed to $55.95 billion late on Tuesday, according to data from CoinGlass, following a 4.5% gain during the preceding 24-hour period to achieve its highest reading since Sept. 25. These kinds of increases in OI amplify the market's vulnerability to cascading long or short liquidations that have the potential to transform brief price reversals into more substantial corrections.
Examining three-day timeframes, BTC/USD encountered rejection at a downward-trending trend line, maintaining a pattern of lower highs. On Tuesday, Rekt Capital, a cryptocurrency trader and analyst, made the case that breaking through this trend line resistance was essential as a precondition for sustained upward price momentum.
Earlier, Cointelegraph had provided coverage regarding the zone spanning $80,000 to $81,500 now establishing itself as crucial support territory, due to the fact that it contains the cost basis for the US spot Bitcoin exchange-traded funds (ETFs).