Bitcoin Targets Its Strongest Third Quarter Performance in Nearly a Decade
Despite dipping under $83,000 at the week's outset due to tensions between the US and Iran, Bitcoin maintains a remarkable 40%+ gain for Q3 as critical inflation and employment reports loom.

As the Q3 candle approaches its close, Bitcoin (BTC) continues trading beneath its 2026 opening level, with emerging resistance limiting additional upward movement for BTC price action.
Key points:
- Following its strongest weekly close since the end of January at $84,450, Bitcoin subsequently retreated to seven-day lows of $82,557 as liquidity dynamics shifted across exchange order books.
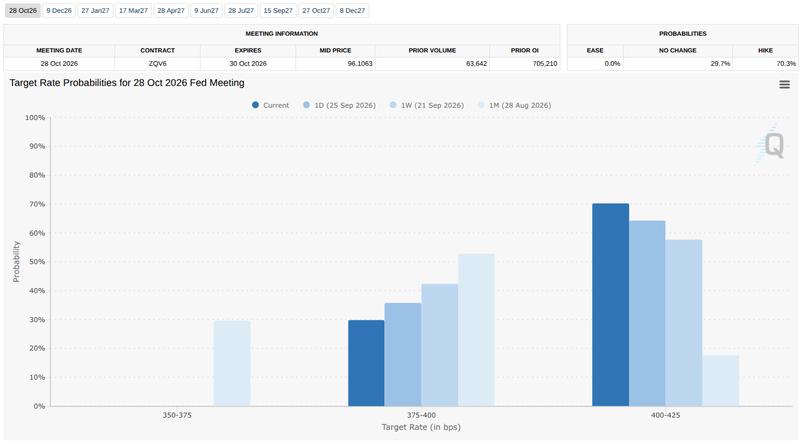
- Market participants are pricing in 70% probability of a 0.25% Federal Reserve interest-rate increase for October, ahead of the upcoming August PCE inflation figures and September nonfarm payrolls report.
- According to analysis from Rekt Capital, Bitcoin needs to hold the $82,500 level to mirror its 2022 bear-market recovery trajectory.
Q3 gains exceeding 40% as BTC price upside momentum slows
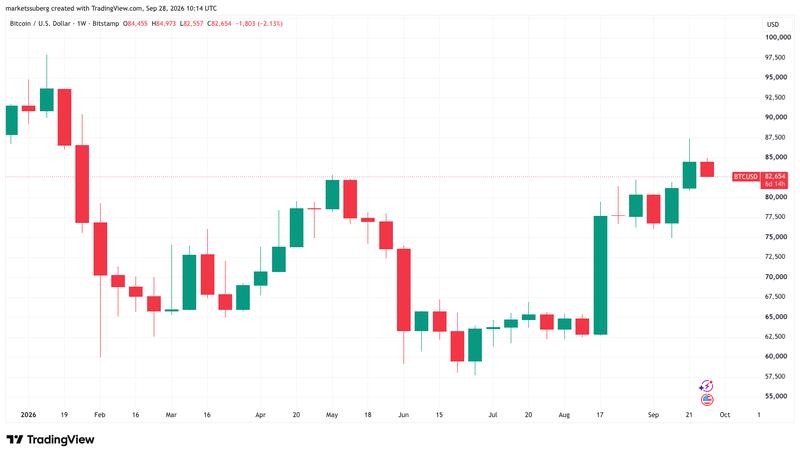
Following Sunday's weekly candle close, Bitcoin experienced selling pressure as the cryptocurrency market mirrored declines in US stock-market futures amid concerns over potential additional US military action against Iran.
According to data from TradingView, BTC/USD slipped beneath the $83,000 threshold to touch seven-day lows. Despite this pullback, the weekly close at $84,450 marked the pair's most elevated finish since the final days of January.
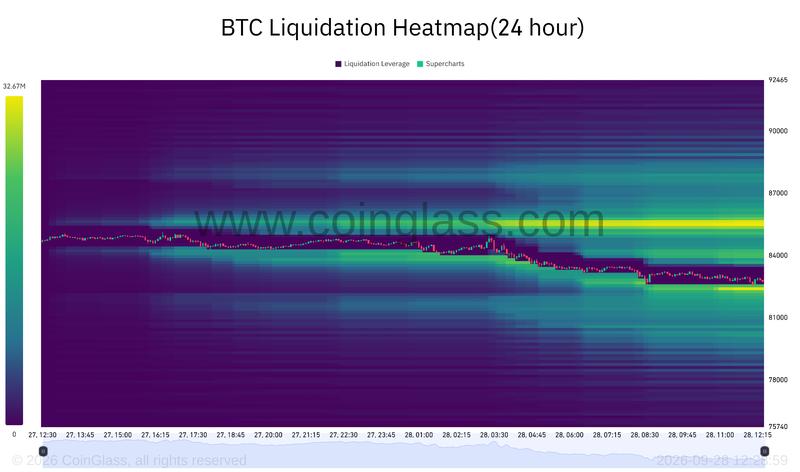
Examining lower time frames reveals that liquidity bands appearing and subsequently disappearing from exchange order books are creating an artificial ceiling to continued BTC price appreciation. Data from CoinGlass shows that on Monday, approximately $30 million in ask liquidity clustered near the $85,700 mark, with the spot price immediately beginning to accelerate its descent in response.
Two additional significant candle closes await traders in the upcoming week. The monthly close for September and the Q3 quarterly close both arrive on Wednesday. Each of these closures is positioned to take place near important BTC price thresholds.
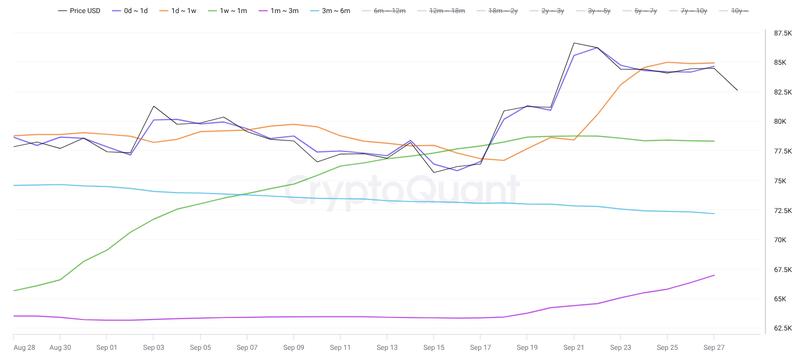
Above the current spot price sit the yearly open for 2026 at $88,700 and the average cost basis for US spot Bitcoin exchange-traded fund (ETF) holders at approximately $86,000. Situated below are the average cost basis for Bitcoin corporate treasuries at $80,500 and the True Market Mean, which represents the aggregate cost basis for active market participants, positioned near $76,700.
The most recent cohort of Bitcoin buyers, those who purchased BTC within the past one to four weeks and who typically demonstrate heightened sensitivity to abrupt price fluctuations, continue holding aggregate profits with a cost basis at $78,300, according to data from onchain analytics platform CryptoQuant.
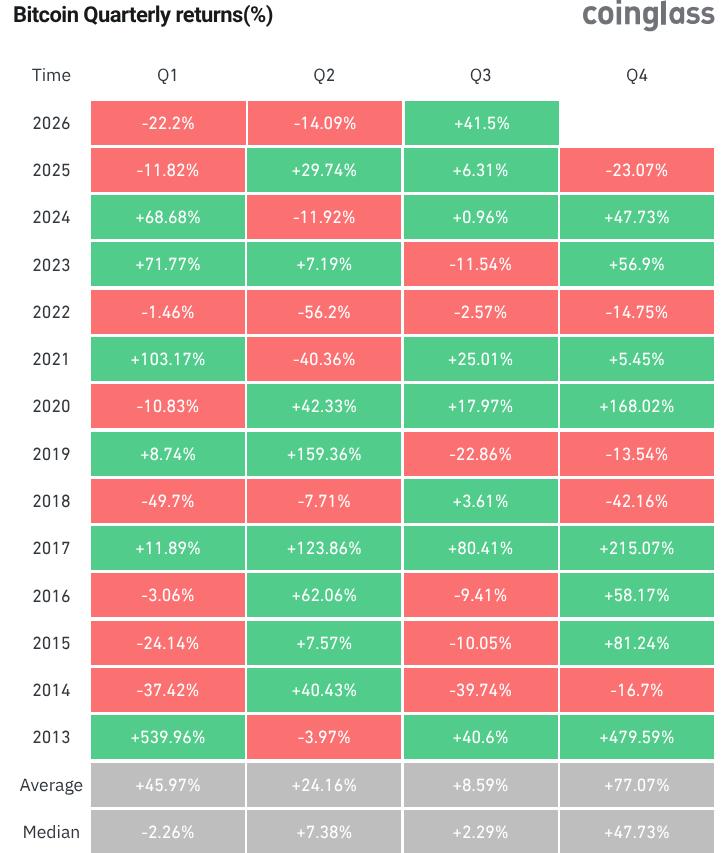
For the current quarter, BTC/USD shows gains exceeding 40%, marking its strongest Q3 showing since 2017. This performance substantially outpaces the pair's historical average Q3 return, which has registered at merely 8.6% since 2013. In comparison, data from CoinGlass indicates that Q4 returns have averaged 77% across the identical timeframe.
Markets maintain hawkish rate expectations as US PCE and jobs data approach
Critical US inflation metrics are scheduled for publication in the coming days while markets intensify their hawkish Federal Reserve policy projections.
The Personal Consumption Expenditures (PCE) index reading for August arrives on Wednesday, with forecasts calling for 3.6% year-on-year and 0.3% month-on-month. PCE holds distinction as the Fed's "preferred" inflation measurement, a designation that chair Kevin Warsh reaffirmed during his keynote address at last month's Jackson Hole economic symposium.
Following the Fed's 0.25% interest rate increase at its September gathering, markets had already begun pricing in additional hikes extending through year-end. Current data from CME Group's FedWatch Tool indicates majority probability supporting another 0.25% hike at the Fed's October gathering, followed by a pause in January before resuming hikes in March.
The probability of a 0.25% hike in October has climbed from 57.7% one week prior to 70.3% as of Monday.
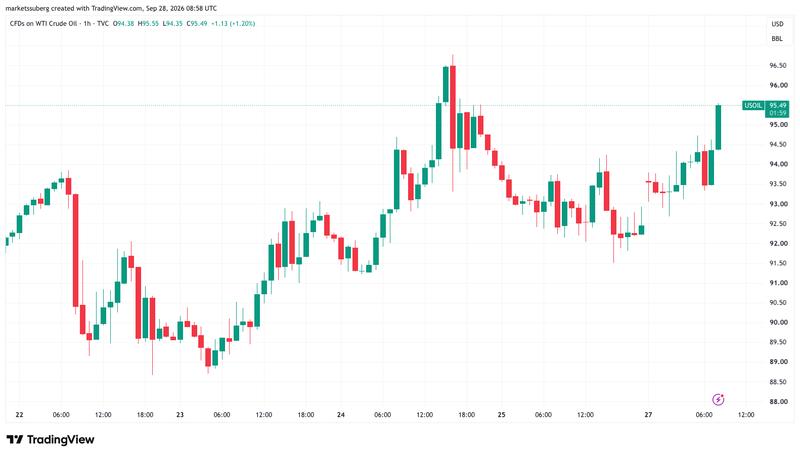
Market sentiment continues demonstrating acute sensitivity to evolving circumstances surrounding the US-Iran war and related volatility in oil markets. Over the weekend, US president Donald Trump dismissed Iran's most recent ceasefire overture while declining to exclude the possibility of additional military operations. WTI crude oil consequently returned to $95 per barrel, posting a 3% gain on Monday.
In comments to Reuters, Hamad Hussain, senior climate and commodities economist at Capital Economics, cautioned that oil-supply challenges were continuing to drive market movement despite modest upticks in transit volumes through the Strait of Hormuz, a critical global oil passage.
While greater flows through the Strait of Hormuz is easing some of the upward pressure on prices, the bigger picture is that the oil market remains in a deficit.
Arriving on Friday, US nonfarm payrolls data for September offers another catalyst for risk-asset volatility. As previously covered by Cointelegraph, the August figures significantly exceeded projections at 162,000 jobs added, reinforcing hawkish Fed expectations as evidence emerged that the labor market was withstanding accelerating inflation more effectively than anticipated. Current estimates project that the US economy added 83,000 jobs last month.
Analysis indicates Bitcoin recovery depends on maintaining $82,500 support
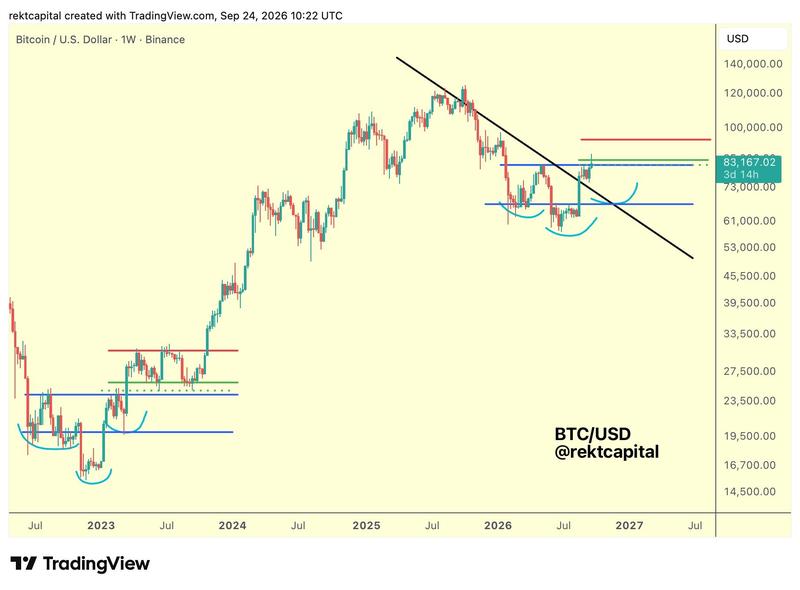
According to price analysis comparing its recent breakout to its 2022 bear-market recovery, Bitcoin now confronts the critical task of preserving $82,500 as a support level.
Trader and analyst Rekt Capital maintains surveillance of an inverse head-and-shoulders formation on the weekly chart — a textbook bullish reversal pattern — seeking confirmation that the 2026 bear market has concluded. Throughout this pattern's development, long-term accumulation occurred simultaneously.
During 2023, BTC/USD finalized the inverse head and shoulders formation before entering a sideways consolidation range positioned directly above it, which persisted throughout most of 2023. During this phase, accumulation activity centered around $30,000 supplied the foundation for the subsequent phase of the bull market.
In this cycle, the ~$82500 level is the analogous level to the very top of the 2022 Accumulation Pattern.
Rekt Capital
For historical patterns to replicate themselves, price action would require maintaining the $82,500 threshold to validate its most recent inverse head-and-shoulders reversal, subsequently establishing what Rekt Capital terms a "reaccumulation range" positioned above.
Fail to turn $82500 into support however and there's a chance Bitcoin reverts back into the $60k - $80k Range and retraces within it.
In prior coverage, Cointelegraph documented several onchain indicators displaying behavior patterns that paralleled activity observed during the conclusion of the 2022 bear market.