Analysts Predict Six-Month Timeline for Bitcoin's Return to $100K Following Flash Crash
Historical patterns and technical analysis indicate that Bitcoin's path back from its sharp weekend decline under $75,000 may require a minimum of six months to complete.

Bitcoin (BTC) concluded its weekly trading session at $76,931 this past Sunday, resulting in BTC dropping beneath its 100-week moving average for the initial time since October 2023. Market analysts are currently evaluating whether this development signals the beginning phase of a bearish market cycle and examining the potential implications for Bitcoin's long-term recovery trajectory.
Key takeaways:
- Bitcoin finished with a weekly candle positioned beneath the 100-week simple moving average, a pattern historically associated with extended multi-month downturns.
- Historical bearish breakdowns below this weekly trend indicator persisted for durations ranging from 182 to 532 days.
- Substantial spot trading volume concentrated between $85,000 and $95,000 could transform this price range into significant resistance territory.
Bitcoin falls beneath crucial long-term weekly indicator
Bitcoin completed a weekly candle positioned under its 100-week simple moving average (SMA), currently situated around $87,500. This development represents the loss of a critical macro-level trend indicator for BTC.
Cryptocurrency advocate Brett observed that, excluding the 2020 COVID-19 flash crash event, Bitcoin has historically experienced prolonged durations trading below the 100-week SMA. Throughout the 2014 to 2015 market cycle, BTC traded beneath this level for 357 consecutive days as valuations fluctuated within a range of $200 to $600 after the 2013 bull run reached its peak.
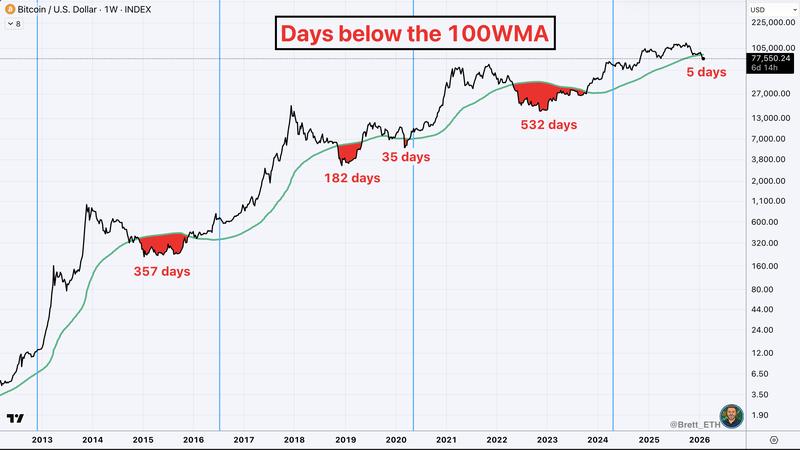
During the 2018 to 2019 timeframe, this duration extended for 182 days, aligning with the bear market bottom phase where prices ranged from $3,000 to $6,000.
During 2022, Bitcoin remained below the 100-week SMA for 532 days following the FTX exchange collapse, with prices consolidating in the $16,000 to $25,000 range.
Every occurrence resulted in an accumulation period instead of a rapid recovery, indicating that time may once more prove to be the crucial element preceding the subsequent bullish cycle.
USDT dominance trends and $85,000 resistance level elevate bear market concerns
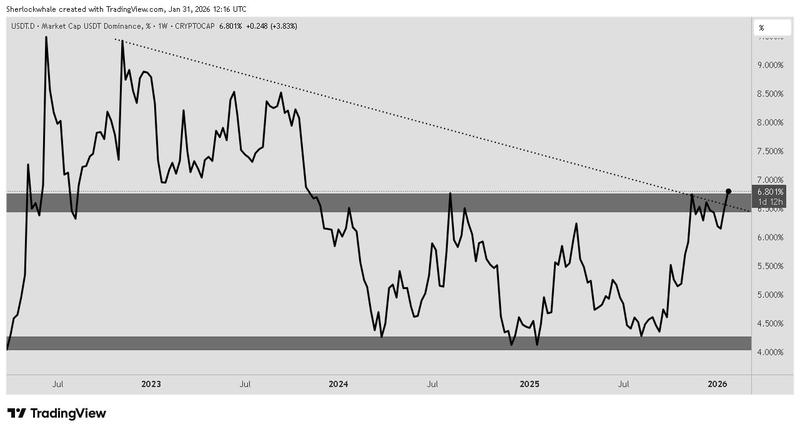
Cryptocurrency analyst Sherlock indicated that bearish market conditions may develop following the USDT dominance chart recording a weekly close exceeding 7.2%. Throughout previous market cycles, a weekly close surpassing 6.7% has confirmed bearish market conditions, rendering the latest breakout—the first occurrence in over two and a half years—especially noteworthy.
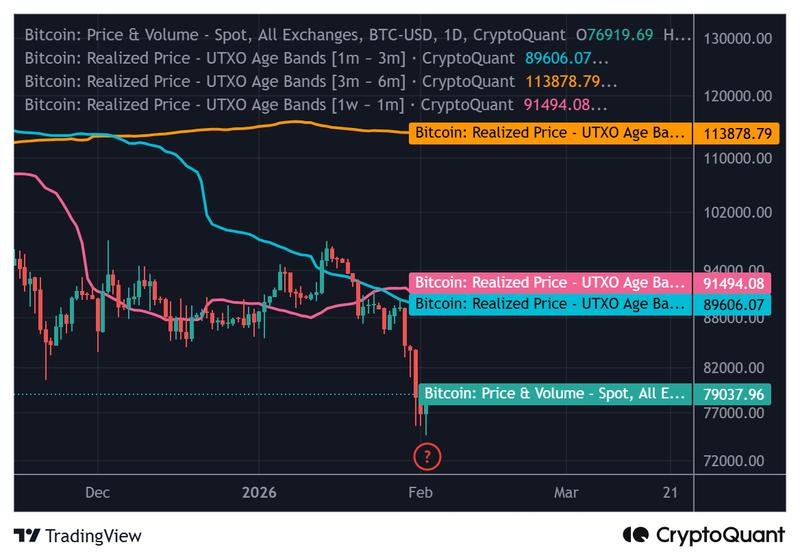
The analyst identified $85,000 as a critical resistance area. Over $120 billion in spot trading volume occurred within the $85,000 to $95,000 range during Q4, 2025, resulting in numerous BTC holders currently experiencing unrealized losses. With BTC trading around $78,000, any upward movement approaching $85,000 could encounter consistent selling pressure as traders potentially seek to exit positions at breakeven levels, considering that the realized price for one-to-three-month holders stands at $91,500.
BTC fractal pattern displays parallels to 2022 downturn
Bitcoin's weekly chart structure is demonstrating parallels to the 2022 decline. During that period, BTC established a series of lower highs, relinquished the 100-week SMA, and proved unable to maintain a recovery effort before entering a more substantial correction phase.
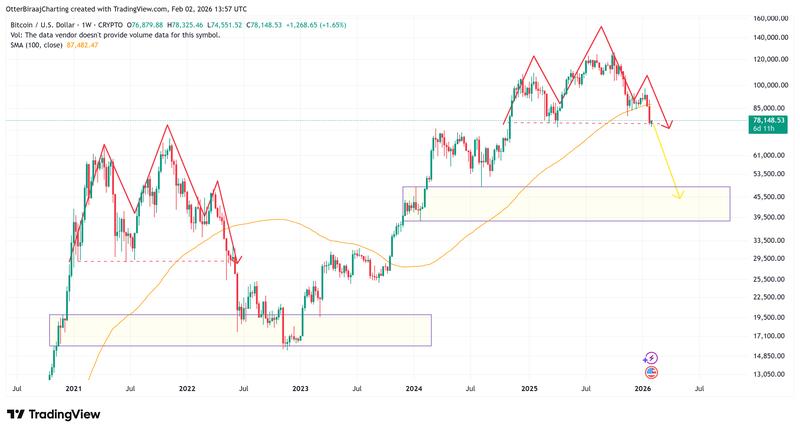
A comparable formation is currently observable in 2026. Should the fractal pattern persist, Bitcoin could potentially retest the $40,000 to $45,000 price zone, which represents a well-established demand area. Although fractals do not guarantee predictive accuracy, the current technical setup indicates that downside risk continues to remain heightened unless Bitcoin successfully recaptures the 100-week SMA with conviction.