Why Bitcoin continues facing challenges in sustaining prolonged bullish momentum
BTC faces ongoing difficulty maintaining rallies beyond the $70,000-$75,000 zone amid weakening ETF inflows, climbing US treasury rates, and profit-taking by traders at key resistance points.

Building sustained upward momentum for Bitcoin (BTC) throughout 2026 continues to prove difficult, particularly as exchange-traded fund (ETF) capital flows have demonstrated minimal expansion following their peak above $60 billion during 2025.
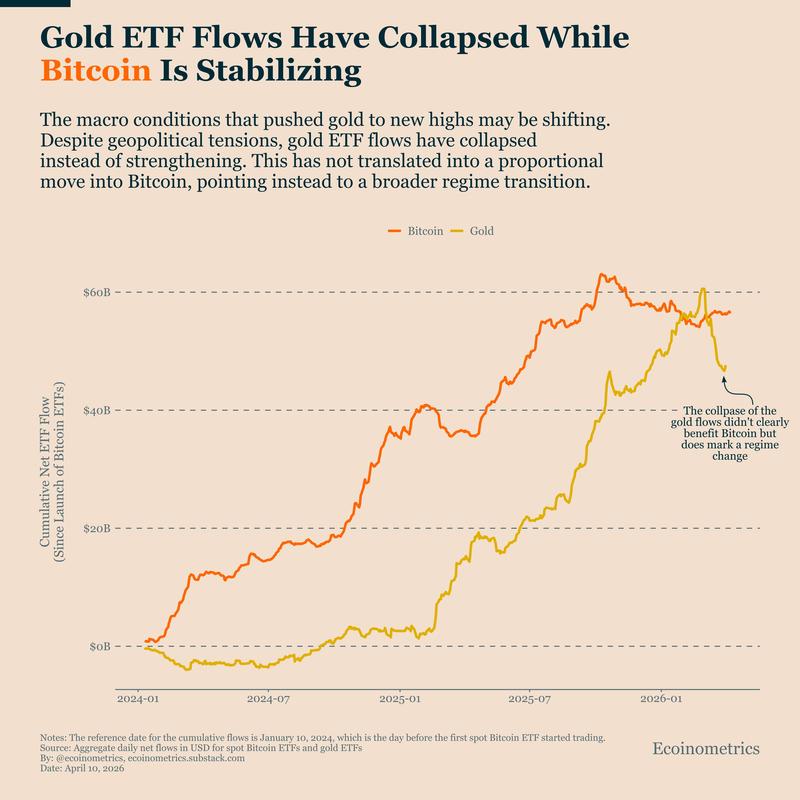
Simultaneously, capital directed toward gold ETFs declined nearly 25% during the first quarter, and the absence of funds rotating into BTC indicates subdued interest from institutional investors.
Pace of Bitcoin demand growth remains sluggish
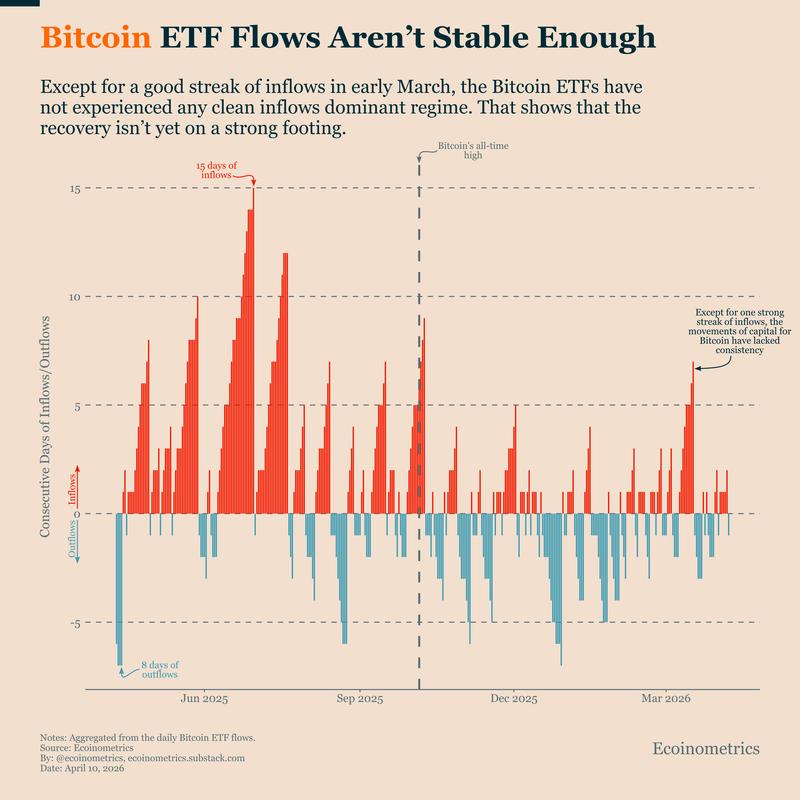
An analysis published by Ecoinometrics reveals a notable transformation in both the demand patterns and sustainability of Bitcoin exchange-traded fund (ETF) capital movements. Prior to BTC reaching its price zenith in October 2025, ETF contributions frequently arrived in prolonged sequences, including a remarkable 15-day period bringing in $4.4 billion during June 2025, which provided crucial support for continuing upward price action.
Such reliability has diminished over the past several weeks. The current trajectory of ETF capital movements has become volatile, with positive inflow periods extending for merely days at a time. Withdrawals have similarly concentrated, extending to as many as 10 straight days and accumulating $3.2 billion throughout January, indicating more short-term responsive trading behavior.
The aggregate statistics confirm this deceleration. Capital movements into Bitcoin ETFs have stagnated within the $55–$60 billion range throughout 2026, demonstrating negligible net expansion. During this identical timeframe, gold ETF flows experienced a precipitous decline to approximately $45 billion from the previous level around $60 billion, yet this has not translated into increased Bitcoin investment interest.
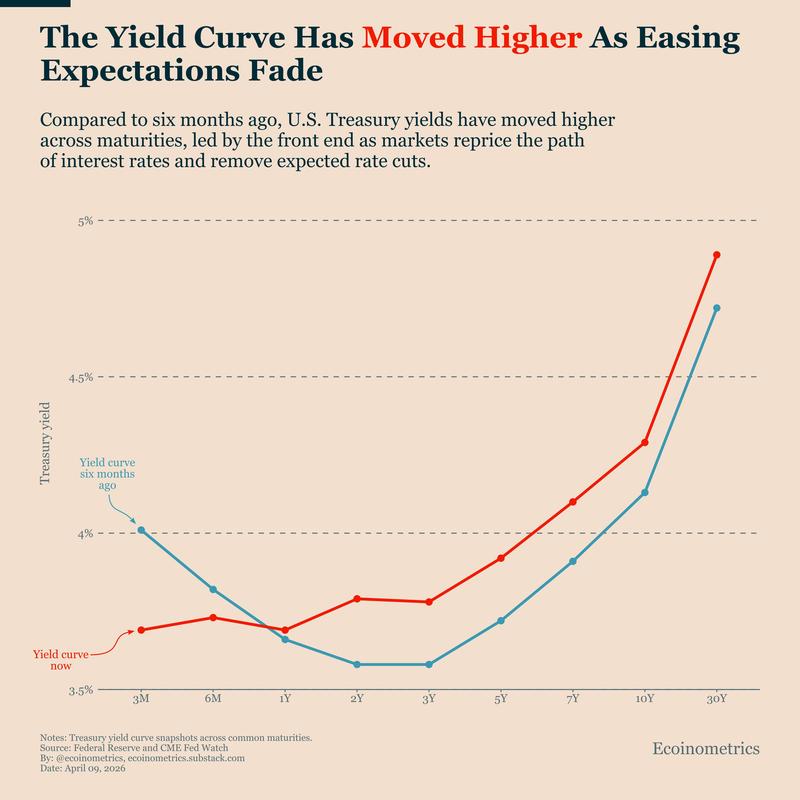
According to Ecoinometrics, the Federal Reserve's continued restrictive stance amplifies this demand weakness. Yields on US Treasury securities have climbed across all maturity periods, with the 30-year yield approaching 4.9% compared to 4.7% half a year earlier, while shorter-term instruments (10-year bond yield) have similarly advanced to 4.3% from the October 2025 level of 3.8%.
These higher yields present attractive alternative returns, diminishing the urgency for continuous ETF-based Bitcoin investment. Ecoinometrics further noted,
"As long as the bond market holds this view, Bitcoin is operating without a liquidity tailwind. And without that tailwind, sustained upside becomes much harder to build."
Will Bitcoin overcome a key resistance level?
Cryptocurrency analyst Ardi pointed out that a significant factor preventing the current BTC price range around $74,000 from breaking upward is the similar trading patterns exhibited by both retail investors and professional market participants. Long position holdings decrease whenever the price approaches resistance zones, while short position exposure simultaneously expands.
The four-hour analytical chart from Hyblock demonstrates this recurring behavioral pattern. Long account positions experience sharp reductions at price peaks, while short positioning accumulates at identical levels. These capital movements interpret upward price movements as selling opportunities rather than signals to increase holdings.
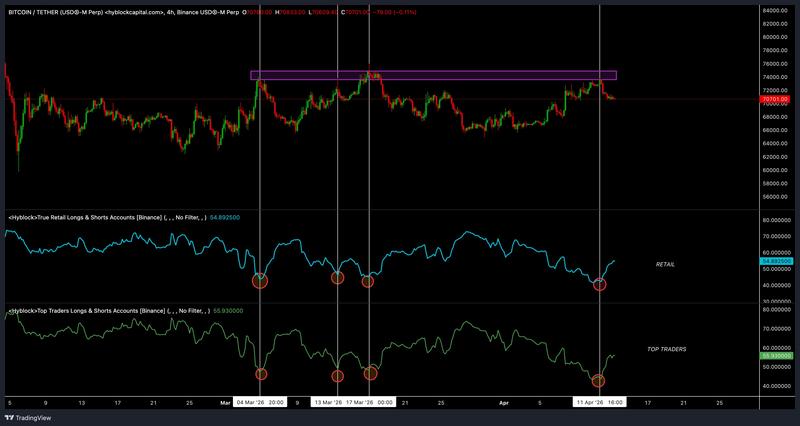
The selling pressure from long position closures encounters new short position entries within the order book. This dynamic strengthens the ceiling at the upper price boundary and disrupts efforts to maintain bullish momentum.
According to Ardi, a reversal of this pattern would necessitate more robust long-term buying activity near the resistance zone, where purchasers would need to absorb the available selling pressure instead of merely reacting to price movements. At present, the positioning behavior observed near $75,000 continues to limit each upward attempt.
Nevertheless, these circumstances may be poised to shift as veteran Bitcoin investor Willy Woo observed the resumption of capital inflows into BTC for the first occurrence since January. In a statement shared on X, Woo remarked,
"Capital flows into BTC just flipped positive, first time since January. Liquidity is repairing... spot remains stable while derivatives after being destroyed 10 Oct is now making its second attempt at rebounding. 80k remains key test level."