Short Squeeze Propels BTC Past $75K as Futures Liquidations Exceed $283 Million
BTC price action remains confined within the $73,000-$75,000 range following liquidation-driven short squeeze, though limited spot market activity prevents sustained upward movement.

During Thursday's New York trading session, Bitcoin (BTC) fluctuated within a range spanning $73,000 to $75,000 across a three-hour window, with the sudden downward volatility resulting in $283 million worth of liquidated futures contracts. This cascade of liquidations sparked a short squeeze that drove BTC prices back in the direction of $75,000, though maintaining this recovery momentum will depend on consistent purchasing volume within spot markets.
BTC experiences recovery despite weaker spot market activity
An abrupt decline from $75,400 down to $73,200 catalyzed a cascade of long position liquidations throughout futures trading platforms, reaching a combined total of $166 million, as reported by market analyst CryptoReviewing.
Following this initial drop, the price experienced a swift reversal, climbing back toward the $75,000 mark and triggering approximately $117 million in short position liquidations, demonstrating a volatile two-directional squeeze occurring within the identical trading session.
Price movements corresponded closely with liquidation activity surges, compelling the closure of bearish positions. Following the price bounce, funding rates shifted into positive territory at +0.0005, indicating that traders had accumulated bearish positions prior to their subsequent unwinding.
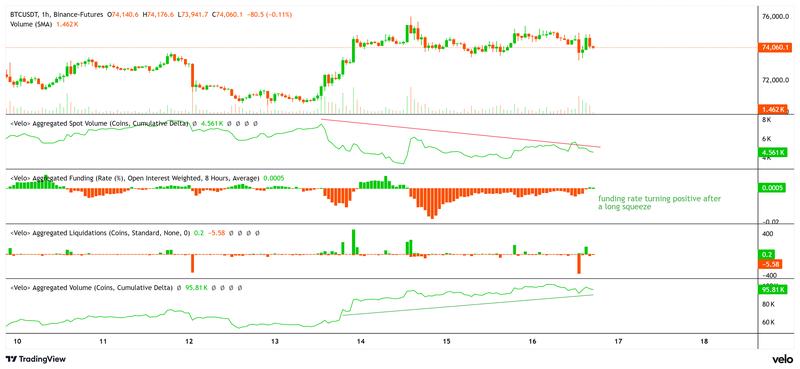
This pattern suggests that the upward price movement originated primarily from short position covering rather than fresh long position entries. The rally eliminated nearby liquidity concentrations and drove the price back toward the middle of the session's trading range.
The cumulative volume delta (CVD) for spot markets, which monitors the net balance of buying versus selling activity in spot trading, maintained a downward trajectory throughout the price recovery phase. This divergence suggests diminished spot market participation despite Bitcoin remaining above the $74,000 threshold.
To achieve a breakthrough above the $76,000 range resistance, spot market demand must intensify in conjunction with derivatives market activity, creating unified market support behind the price movement.
Key inflection points emerge from Bitcoin's liquidity mapping
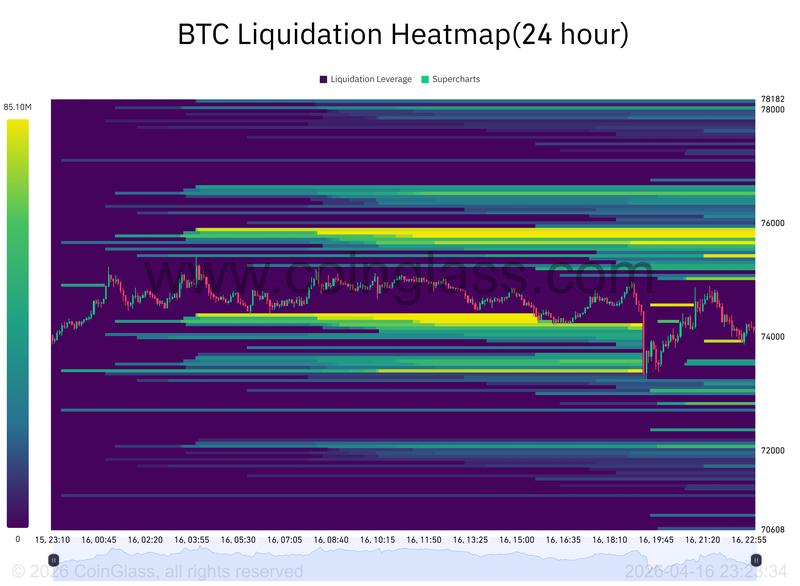
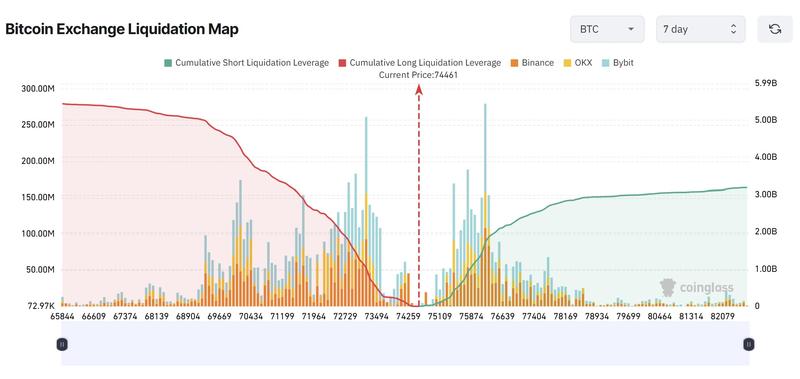
Bitcoin's price action continues navigating between well-defined liquidity accumulation zones, with the asset gravitating toward critical price thresholds. Market analyst KriptoHolder identifies the $76,000–$78,000 corridor as hosting a dense supply zone containing $2.81 billion in leveraged short positions, whereas $74,000 functions as a balance point.
Below the $72,000 level sits $2.5 billion in leveraged long positions, establishing a possible downside target should the price fail to penetrate the upper resistance levels.
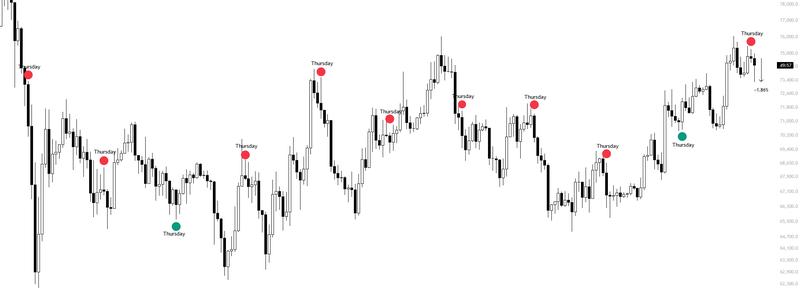
Concurrently, short-term trading patterns reveal consistent intraday tendencies. Bitcoin analyst Killa observed that in eight out of the most recent 11 Thursdays, downward price movement exceeded upward action. The current Thursday's trading has already witnessed approximately 2% depreciation from the daily opening price, presenting intraday trading prospects consistent with this established pattern.