Cryptocurrency Market Analysis for March 27: BTC, ETH, BNB, XRP, SOL, DOGE, HYPE, ADA, BCH, LINK Price Outlook
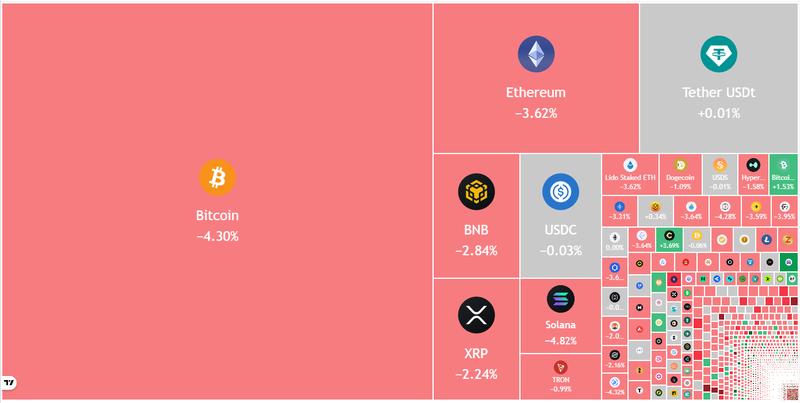
Major cryptocurrencies including Bitcoin and prominent altcoins have experienced significant downward pressure, signaling bearish market sentiment as sellers attempt to gain control.

Key points:
The decline of Bitcoin beneath the crucial $66,000 support zone increases the likelihood of a potential correction toward the $62,500 price level.
Several prominent altcoins have breached their near-term support zones, creating conditions for additional downward movement.
Bears are currently exerting significant pressure on Bitcoin (BTC), working to keep the cryptocurrency trading below the critical $66,000 threshold. Market uncertainty stemming from the ongoing US and Israel-Iran conflict continues to limit upward momentum while amplifying downward forces. Data from Farside Investors indicates that US spot Bitcoin exchange-traded funds experienced $171 million in net outflows on Thursday, representing the largest single-day withdrawal since the $348 million in redemptions recorded on March 3.
An encouraging indicator for bullish market participants is the continued accumulation by BTC whales and sharks. In a post shared on X, Santiment revealed that major BTC holders with positions ranging from 10 to $10,000 BTC have increased their aggregate holdings by 0.45% over the past month. Historical market patterns indicate that upward price breakouts typically occur when large wallet holders are accumulating while retail investors are distributing.
Will BTC and major altcoins successfully maintain their important support zones? Let's examine the technical charts of the leading 10 cryptocurrencies to determine potential outcomes.
Bitcoin price prediction
Market participants on the buy side were unable to keep BTC trading above the $72,000 threshold on Wednesday. This failure likely triggered selling activity that drove the price beneath the support trendline of the ascending triangle formation on Friday.
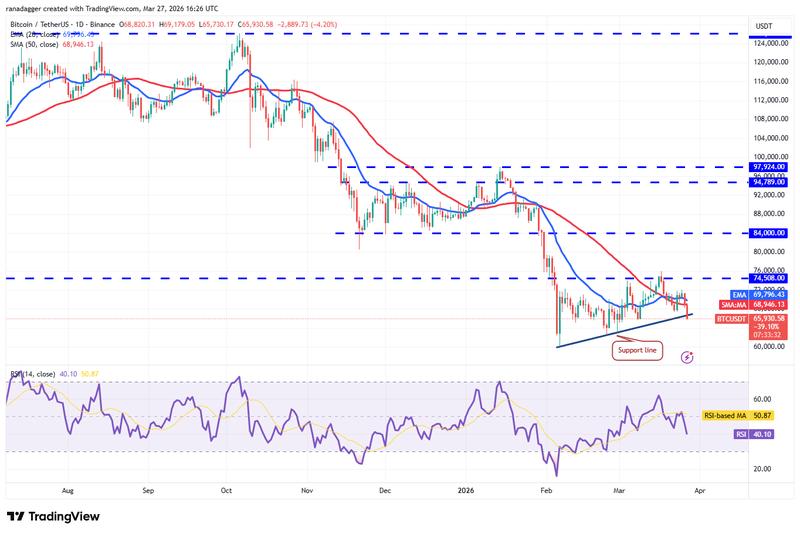
Should the BTC price settle below the support trendline at the daily close, the constructive chart pattern will be negated. This development could accelerate selling pressure, driving the BTC/USDT pair down toward the support zone spanning from $62,500 to $60,000.
Conversely, if the price demonstrates a strong reversal from current levels and manages to break above the $72,000 threshold, it would indicate that bullish forces are attempting to regain market control. The pair could then move to test the significant $74,508 resistance level. If purchasing pressure overcomes this barrier, the pair has potential to advance toward $84,000.
Ether price prediction
Ether (ETH) reversed direction and dropped below the breakout threshold of $2,111 on Thursday, signaling that bearish market participants are attempting to reassert dominance.
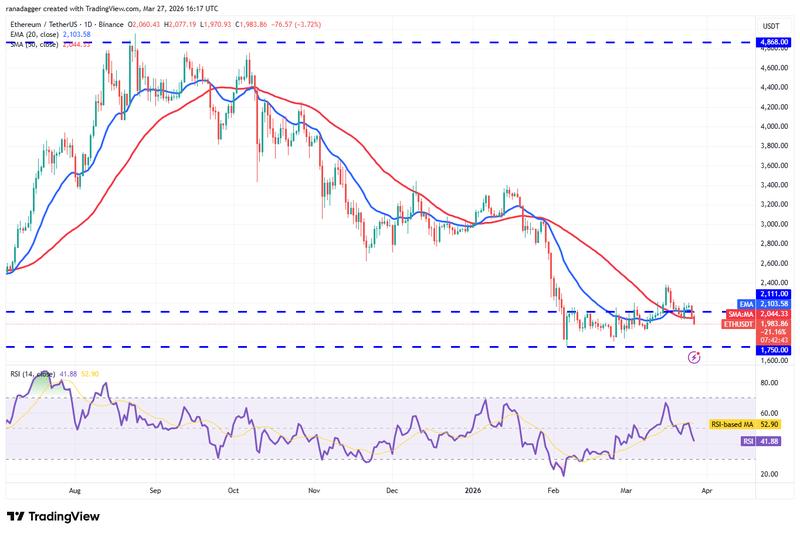
Selling momentum persisted as the ETH/USDT pair was pushed beneath the 50-day simple moving average ($2,044) on Friday. The ETH price could descend toward the $1,900 level, a zone that will likely draw buying interest. Nevertheless, if bearish pressure continues to dominate, the pair might plunge to the critical $1,750 support zone.
This bearish outlook will be nullified in the short term if the price stages a sharp recovery and climbs above the $2,200 threshold. Such a move would improve the probability of a sustained rally beyond the $2,400 level.
BNB price prediction
BNB (BNB) has been trading within a range between $570 and $687 over recent weeks, demonstrating accumulation near the lower bound and distribution approaching the upper boundary.
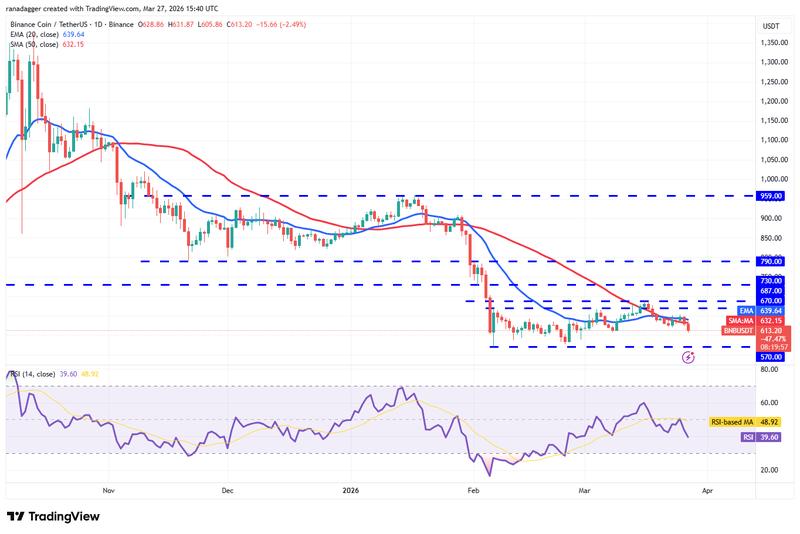
A modest support zone exists at $607, but should this level fail to hold, the BNB/USDT pair could decline toward the $570 level. A robust rebound from the $570 support would indicate that the pair is likely to continue trading within this established range for an extended period.
The subsequent directional trend is anticipated to commence either on a daily close beneath $570 or above $687. If buyers successfully breach the overhead resistance, the BNB price could advance to $790. In the alternative scenario, a close below $570 may send the pair down to the psychologically significant $500 level.
XRP price prediction
XRP (XRP) reversed from the moving average convergence on Thursday, suggesting that bearish forces maintain market control.
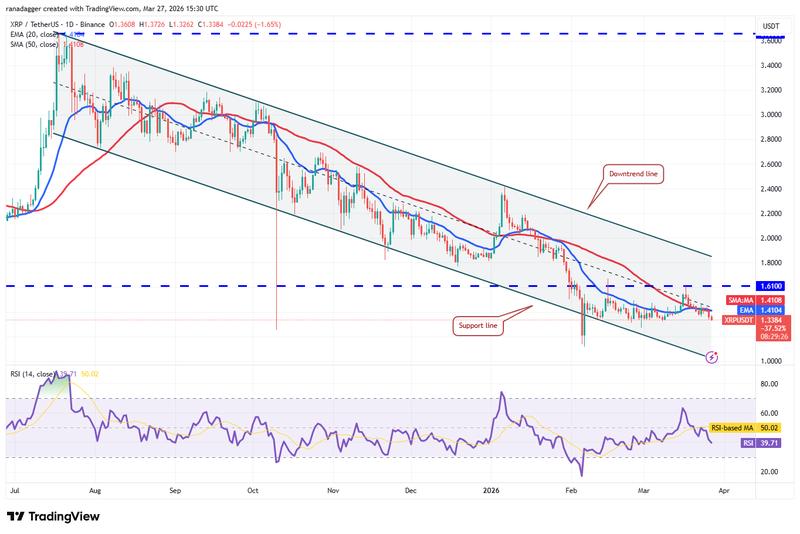
The XRP price could slip toward $1.32 before potentially reaching $1.27. Buyers will likely mount a vigorous defense of the $1.27 threshold, but should sellers prevail, the XRP/USDT pair may continue declining toward the support trendline.
The initial indication of bullish strength will emerge with a daily close above the moving averages. The pair could then climb to the breakdown level at $1.61, which is anticipated to present a formidable obstacle for bulls. Should buyers successfully penetrate the $1.61 level, the subsequent target is likely to be the downtrend line.
Solana price prediction
Market bulls made an effort to drive Solana (SOL) above the $95 resistance threshold on Wednesday, but bearish forces successfully defended this level.
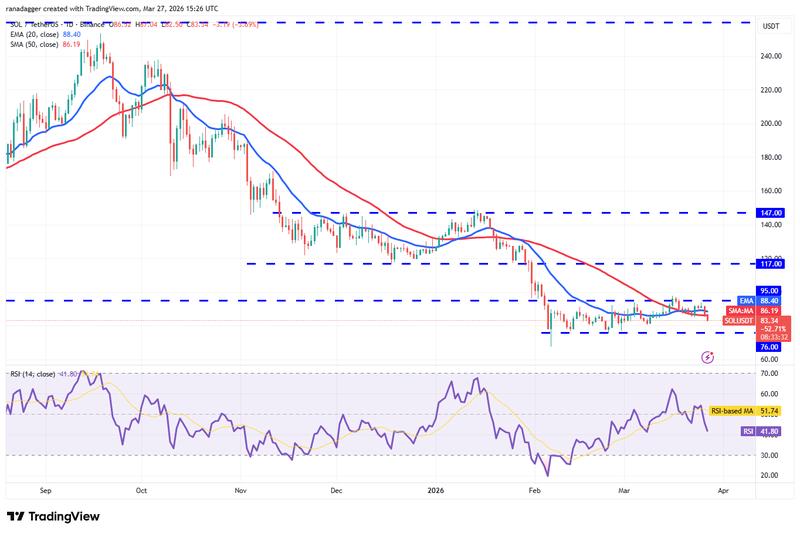
The SOL price has fallen beneath the 50-day SMA ($86), signaling that bullish momentum has dissipated. This development suggests the SOL/USDT pair may continue consolidating within the $76 to $95 range for an additional period.
The next significant directional movement is expected to initiate upon a decisive break either above or below this range. Should bulls successfully drive the price above $95, the pair may advance toward the $117 level. On the bearish side, a close beneath $76 could send the pair tumbling to $67.
Dogecoin price prediction
Dogecoin (DOGE) climbed above the moving averages on Wednesday, but purchasing pressure was insufficient to maintain these elevated levels.
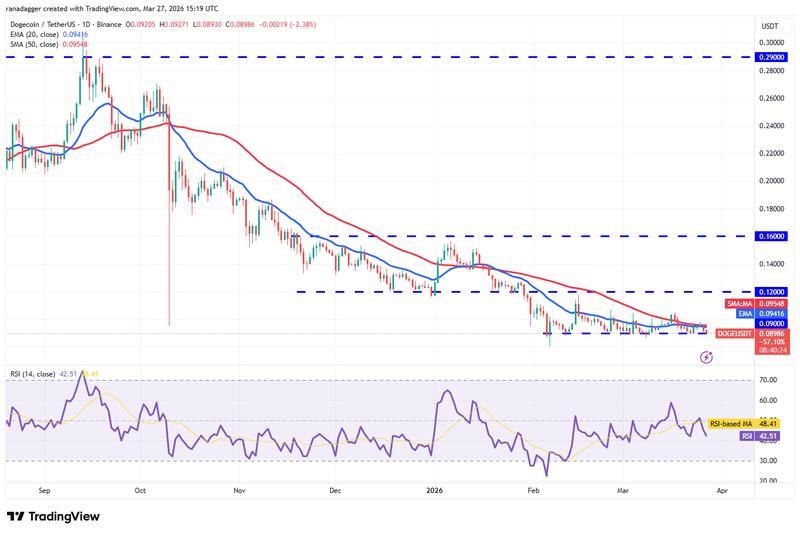
The DOGE price reversed course on Thursday, with bears successfully pushing the DOGE/USDT pair below the crucial $0.09 support threshold. If selling pressure manages to keep the price beneath $0.09, the pair could experience a sharp decline to $0.06.
Bullish market participants are not expected to surrender easily. They will make efforts to protect the $0.09 level and rapidly push the price back above the moving averages. Should they accomplish this objective, the pair may climb to $0.10 and subsequently to $0.12.
Hyperliquid price prediction
Hyperliquid (HYPE) experienced a reversal from $41.59 on Wednesday but is expected to encounter support within the zone between the 20-day exponential moving average ($37.64) and the breakout threshold of $36.77.
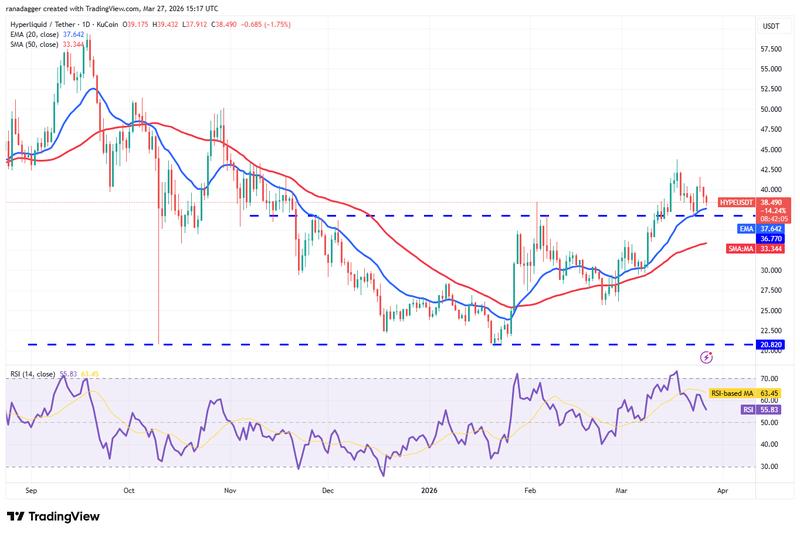
Should the HYPE price rebound from the $36.77 level, it would indicate that bulls are working to convert this level into a support floor. Buyers will work to consolidate their position by propelling the HYPE/USDT pair above the $43.77 threshold. If this objective is achieved, the pair may initiate its upward trajectory toward $50.
In contrast to this scenario, if the price continues its descent and breaks beneath $36.77, it would suggest that bullish control is weakening. The pair may drop to the 50-day SMA ($33.34), a level that is likely to attract renewed buying interest.
Cardano price prediction
Market bulls managed to push Cardano (ADA) above the 50-day SMA ($0.27) on Wednesday but were unable to maintain these higher price levels.
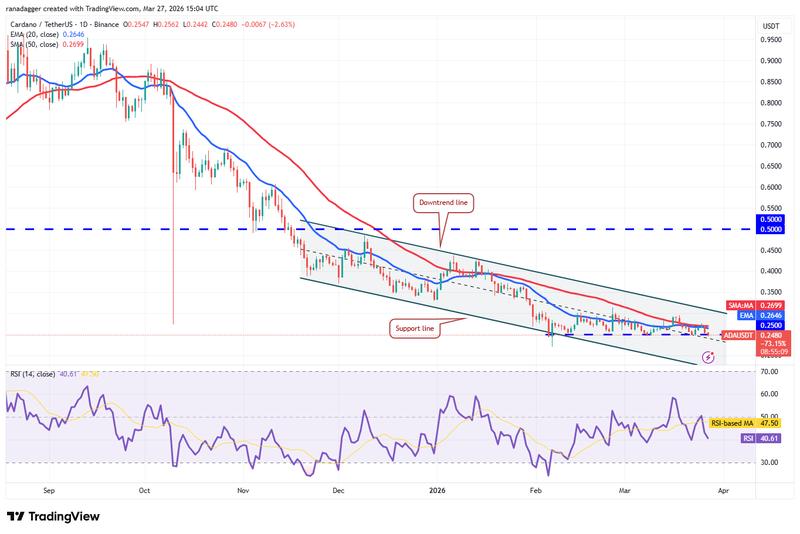
The ADA/USDT pair experienced a sharp reversal on Thursday, indicating that bearish participants have resumed their selling activity. Substantial support exists at $0.25, but if this level is breached, the ADA price may decline to $0.22.
This bearish scenario will be negated in the near term if the price demonstrates a strong reversal from the $0.25 level and achieves a close above the moving averages. Such a development would open the pathway for a rally toward the downtrend line.
Bitcoin Cash price prediction
Bitcoin Cash (BCH) dropped below the 20-day EMA ($468) on Thursday, suggesting that bearish market participants are working to maintain control.
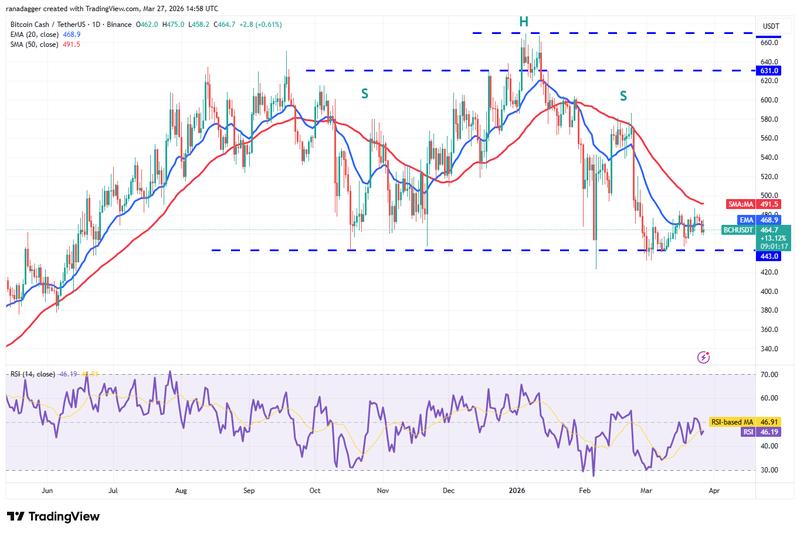
The BCH/USDT pair could decline toward the $443 support level, representing a critical threshold for market observers. Should bears succeed in driving the BCH price below the $443 level, the pair will finalize a bearish head-and-shoulders pattern formation. This completion may trigger a descent toward $375.
In the opposite scenario, if the price reverses upward from the $443 level, it would signal robust buying activity at lower price ranges. The pair may establish a consolidation range between $443 and the 50-day SMA ($491) for a period. Bulls will need to push and sustain the price above the 50-day SMA to indicate the commencement of a sustained recovery movement toward $520.
Chainlink price prediction
The rebound attempt in Chainlink's (LINK) price lost momentum at $9.50 on Wednesday, suggesting that bearish forces are actively selling during price rallies.
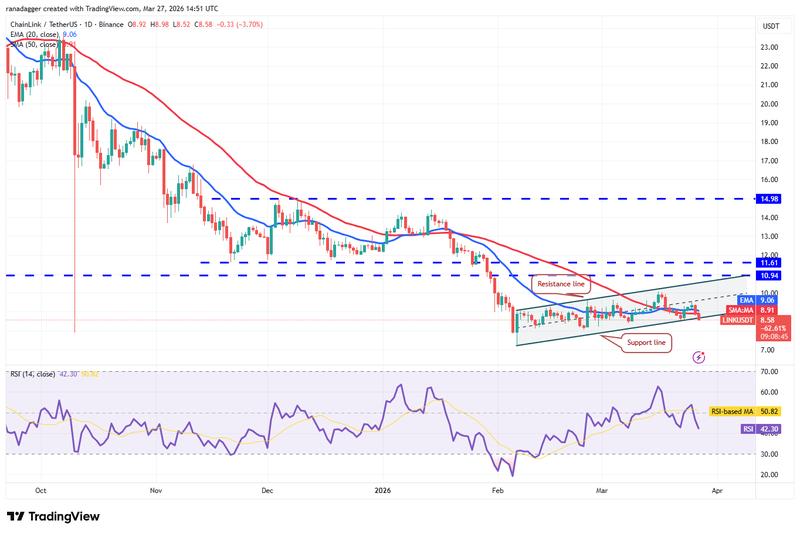
The price reversed sharply downward on Thursday, with bears successfully driving the LINK/USDT pair beneath the support trendline of the ascending channel pattern formation. If the LINK price settles below the channel at the close, the pair may experience a decline to $8.05 and subsequently to $7.15.
Bullish market participants likely have alternative strategies. They will make attempts to maintain the price within the channel boundaries and drive the pair above the $9.50 threshold. Should they succeed in this endeavor, the pair may rally toward the resistance trendline.