Bitcoin's First Bullish Indicator Since 2025? Key Market Factors This Week
A confluence of macroeconomic uncertainty and geopolitical tensions confronts Bitcoin this week while a traditional BTC price indicator hints at an upcoming bullish signal.

This week presents Bitcoin (BTC) with a renewed confrontation as macroeconomic pressures stand in opposition to a potentially bullish BTC price trend shift.
- A traditional BTC price indicator is poised to turn bullish for the first time in close to a year — when this last occurred, the price surged $25,000 within two months.
- Liquidation events hit shorter time frames as "aggressive" market participants enter positions around $70,000.
- Tensions surrounding the Iran conflict approach a critical juncture as US President Donald Trump's "Bridge Day" deadline draws near.
- A series of US inflation reports will be released as the ongoing conflict starts to manifest in economic data.
- The Bitcoin bear flag pattern remains active, with technical analysis suggesting that fresh lows are "likely just a matter of time."
MACD metric hints at significant bullish crossover
Looking at extended time frames, the weekly chart has emerged as a beacon of optimism for Bitcoin bulls during this period.
The weekly candle closure successfully recaptured the 200-week exponential moving average (EMA) trendline, but even more significantly, a well-established BTC price indicator is on the verge of delivering an important bull signal.
Examining the weekly timeframe, the moving average convergence/divergence (MACD) suggested that Bitcoin's most recent downward trend may be undergoing a reversal.
"Holding this level is crucial for the entire Crypto industry," X commentator Crypto Seth stated on Monday, observing that Ether (ETH) was similarly positioned for an MACD crossover.
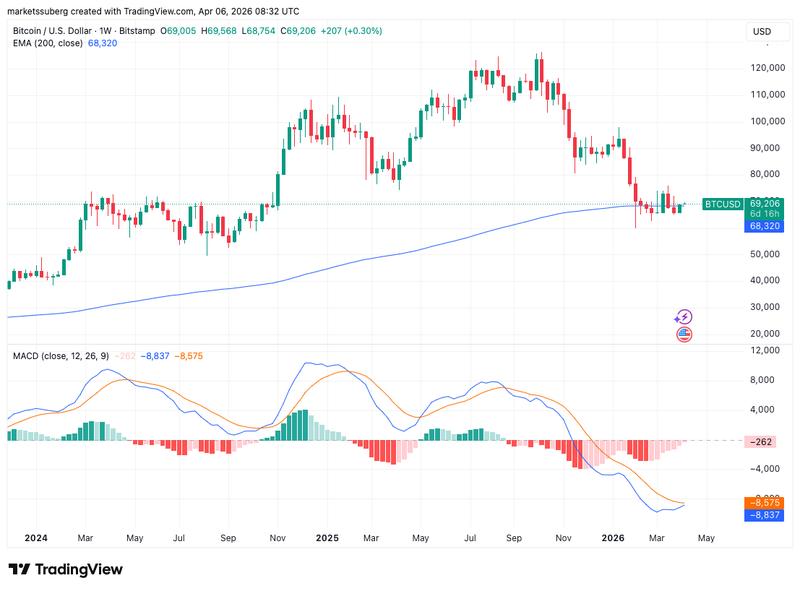
The most recent bullish weekly MACD flip for Bitcoin took place in May 2025, approximately one month following BTC/USD establishing its 2025 bottom near $74,500. Throughout the subsequent two-month period, the price climbed from $94,000 to $119,000, establishing fresh all-time highs.
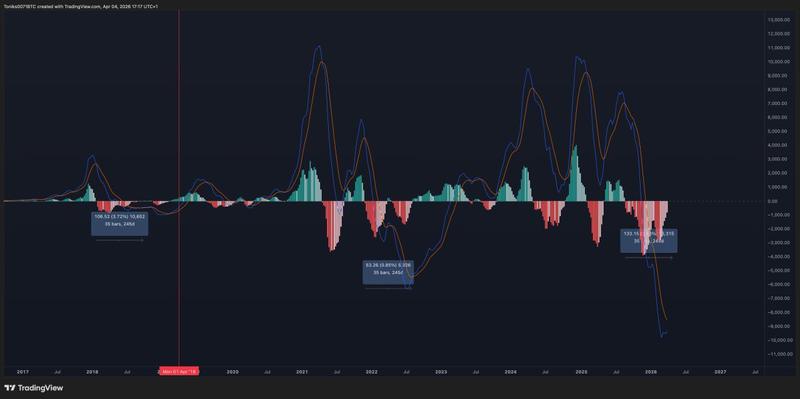
Expanding on this pattern, X trading resource GalaxyTrading highlighted important MACD parallels spanning Bitcoin's previous two bear market cycles.
"In the 2018 bear market, it took around 245 days for the weekly MACD to turn positive," it observed.
"In 2022, it also took 245 days to turn bullish. In 2026, we will reach 245 days by the end of April."
Liquidation volumes surge as Bitcoin reaches $70,000
Following the weekly close, Bitcoin successfully pushed past the $70,000 mark, according to data from TradingView, achieving new highs for April.
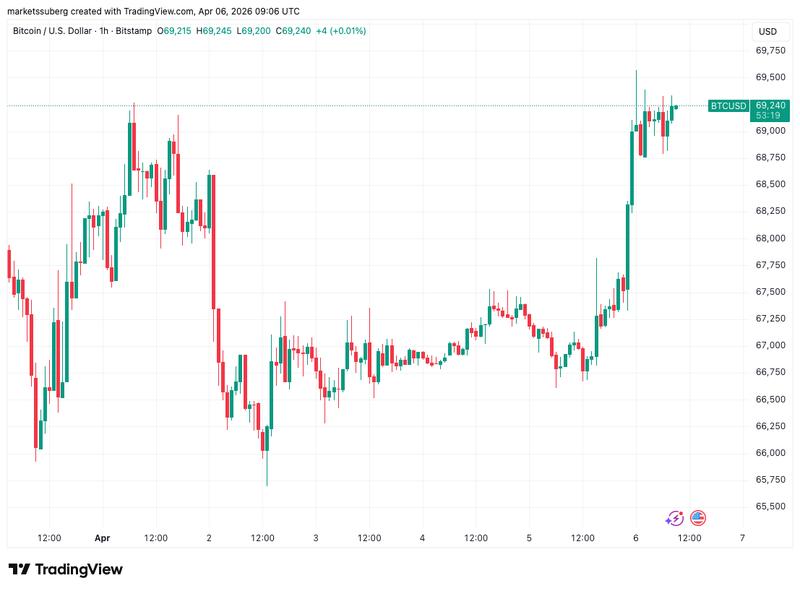
Though certain market participants maintained doubts regarding pre-market price movements, the close itself held significance, reestablishing both the 200-week EMA and the previous 2021 all-time high as possible support zones.
According to Cointelegraph's reporting, both price levels have attracted questions regarding their dependability.
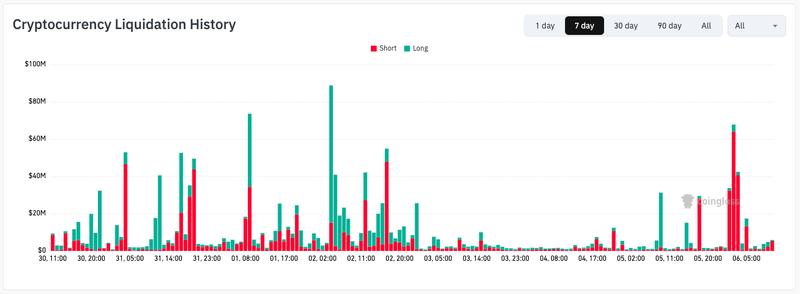
The advance to local peak levels surprised short-position holders, with aggregate crypto liquidations surpassing $250 million during the 24-hour window leading to the time of writing, according to data from CoinGlass.
In his most recent technical evaluation, trader CrypNuevo maintained focus on long positions nearer to $64,000 for a possible liquidity sweep toward the downside.
"There are some HTF liquidations between $64k-$64.5k. This adds fuel a move lower. I don't see conclusive data on LTF liquidations," he stated in an X thread on Sunday.
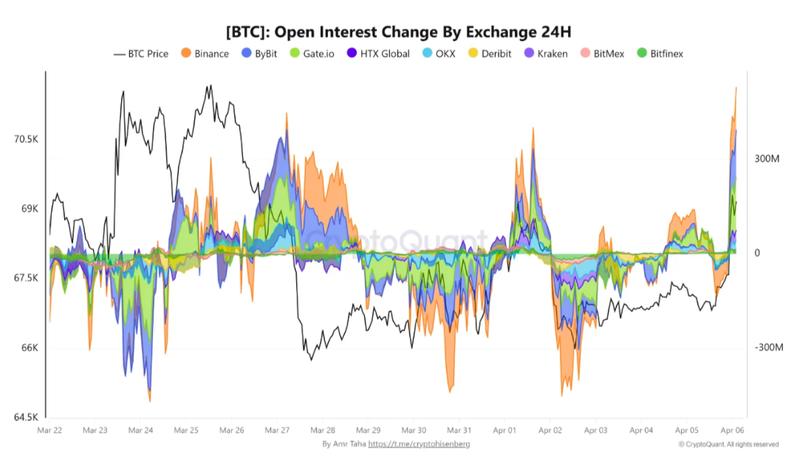
Within one of its "QuickTake" blog entries, onchain analytics platform CryptoQuant pointed to the reemergence of "aggressive short-term positioning" — increases in both cumulative net taker volume and open interest on Binance.
This holds importance because Bitcoin's upward movement is being propelled not solely by price momentum, "but also by renewed speculative participation in derivatives," contributor Amr Taha observed.
"In simple terms, traders are becoming more willing to add fresh exposure as BTC pushes higher. If this trend continues, it could reinforce short-term momentum."
Trump's Iran "Bridge Day" creates market uncertainty
A convergence of geopolitical developments and critical US inflation statistics creates conditions for a week of "extreme volatility," according to market analysis.
The ongoing US-Israel and Iran conflict continues to influence market sentiment, and petroleum prices mirror the unpredictability surrounding crucial matters such as the partial blockage of the Strait of Hormuz. WTI crude oil commenced the week climbing above $115 per barrel.
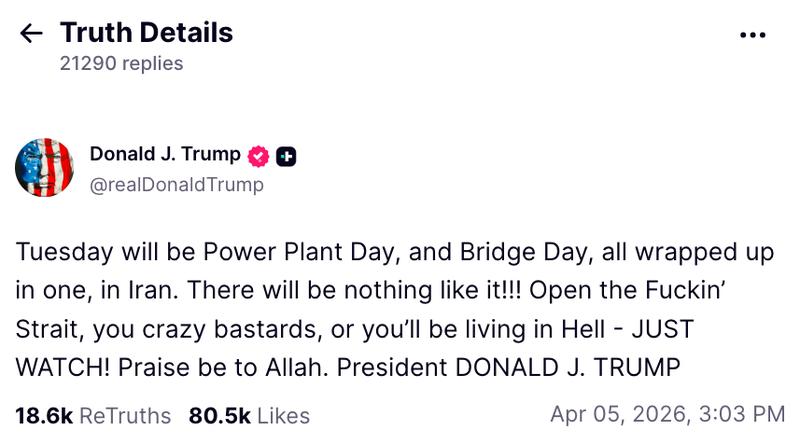
Market participants are now monitoring one specific deadline regarding the potential trajectory of the conflict: Tuesday, 8pm Eastern time. This represents when US President Donald Trump has promised significant infrastructure attacks if negotiations with Iran fail.
In a Truth Social post over the weekend, Trump displayed notable impatience, referring to the deadline day as "Power Plant Day" and "Bridge Day" while insisting that Hormuz be reopened.
News developments continue to present mixed signals, however, with discussions of a 45-day ceasefire now becoming a focal point.
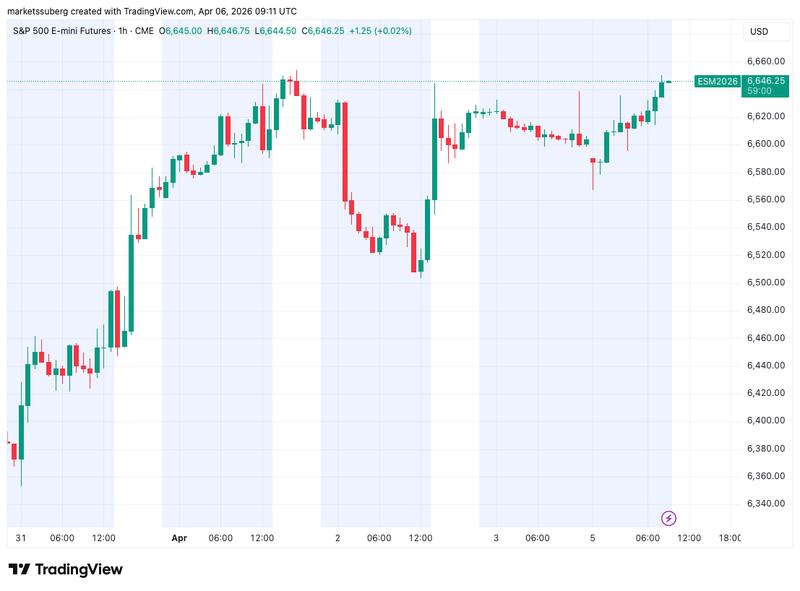
"This is being described as a 'last-ditch effort' to prevent 'massive strikes on Iranian civilian infrastructure,'" trading resource The Kobeissi Letter shared on X.
Kobeissi observed that S&P 500 futures "erased all losses" following the news, highlighting the susceptibility of risk-assets to war-driven catalysts. According to Cointelegraph's reporting, Bitcoin is no exception to this pattern.
During the previous week, macro investor and former hedge fund manager James Lavish indicated that markets were calculating probabilities of the war concluding in the near term rather than extending further.
A possible decline for BTC price movement should markets encounter a "black swan" scenario, he informed Cointelegraph, could reach as high as 20%.
Risk-sensitive assets confront dual US inflation releases
Markets will therefore be navigating both war-related shocks and inflation data simultaneously this week, with several US releases scheduled.
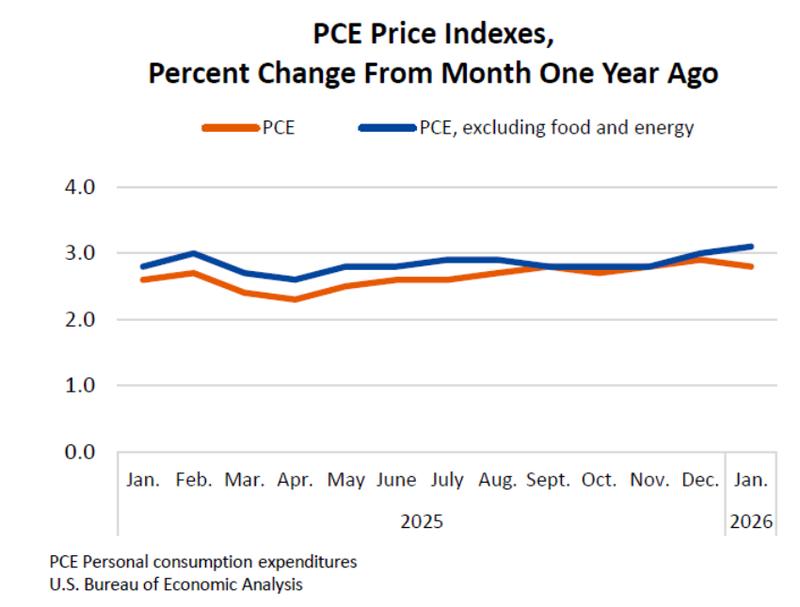
Included among these is the Personal Consumption Expenditures (PCE) Index, recognized as the Federal Reserve's "preferred" inflation measurement.
The February PCE release aligned with market forecasts, but failed to capture inflation dynamics following the commencement of the war.
This same risk extends to the week's final and perhaps most significant inflation figure: the Consumer Price Index (CPI).
In this case, the oil-price surge holds particular relevance, due to its immediate influence on CPI inflation trajectories.
"Oil prices are now crossing above $115/barrel in the US. As a result, our models indicate that if current levels are sustained another ~7 weeks, US CPI inflation will rise to ~3.7%," Kobeissi stated.
Kobeissi indicated that its "base case" for CPI inflation currently stands at 3% — substantially above the Fed's target level.
Similar to PCE, the most recent CPI reading remained stable, helping to mitigate the effect of earlier increases.
The most current data from CME Group's FedWatch Tool indicates virtually no probability of the Fed either increasing or decreasing interest-rates during its upcoming meeting at the conclusion of April.
Fresh lows "just a matter of time?"
While macro developments unfold, Bitcoin continues to face a particular technical pattern that market participants worry will solely drive price in a downward direction.
BTC/USD remains engaged in a struggle for support at the lower boundary of its second bear flag formation of 2026. The initial flag, which emerged in January, produced a decline of approximately $25,000.
"Structurally, $BTC price action is still nearly identical to the prior bear flag structure," Keith Alan, cofounder of trading resource Material Indicators, cautioned last week.
"Nothing says that it has to continue to mimic that price behavior, but I'm following it like roadmap until price deviates from that path."
Regarding the prospect of new lows, Cointelegraph documented widespread agreement that February's downward wick beneath $60,000 will be tested again.
"When that breakdown eventually happens, watch the behavior closely. If price starts repeatedly sweeping the lows, making it psychologically difficult to enter longs, that's when a true bottom is more likely forming," pseudonymous trader LP shared with X followers this weekend.
LP suggested that fresh lows were "likely just a matter of time."
Alan, for his part, focused attention on a potential move to the mid-$40,000 region as part of a "measured move" beneath bear-flag support.
"Expecting to test resistance in the $67k - $69k range before the next leg down," he wrote while addressing the subject on X.
"End to the war or a really strong Q2 Open could invalidate the bear flag and challenge resistance at the MACRO structure."