Bitcoin Plunge to $72.6K Triggers $935M in Cryptocurrency Liquidations
The cryptocurrency market experienced more than $935 million in liquidations as market participants now view $70,000 as Bitcoin's critical support level.

During Thursday's early Asian trading hours, Bitcoin (BTC) experienced a significant sell-off, plummeting to $72,600 and triggering substantial liquidations of leveraged positions throughout the cryptocurrency market.
Key takeaways:
- The Bitcoin price experienced a 4.5% decline from Wednesday's daily peak of $76,050, reaching a six-week bottom at $72,620.
- Positions worth nearly $935 billion were liquidated from overleveraged cryptocurrency traders within the previous 24-hour period.
- Market analysts indicate that Bitcoin must maintain support above $70,000 to prevent a more severe correction that could push prices toward $65,000 or below.
Bitcoin price reaches 6-week lows beneath $73,000
Thursday saw the BTC/USD trading pair decline to a low of $72,620, erasing all price increases achieved since April 13 following reports of the United States conducting a fresh round of military operations against Iran.
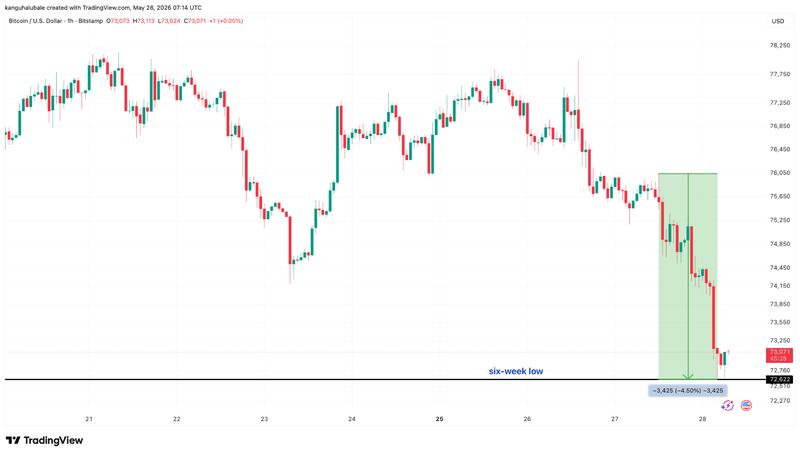
Accompanying this decline were substantial decreases across other leading cryptocurrencies by market capitalization, resulting in over $80 billion being eliminated from the total crypto market capitalization during the past 24 hours.
The derivatives sector experienced comparable devastation. Long positions totaling more than $874 million were liquidated, with Bitcoin representing $348.5 million of this amount. Ether (ETH) was second with $228.5 million in liquidated long positions.
In total, the market saw $935.6 million eliminated through both short and long position liquidations, as illustrated in the graphic below.
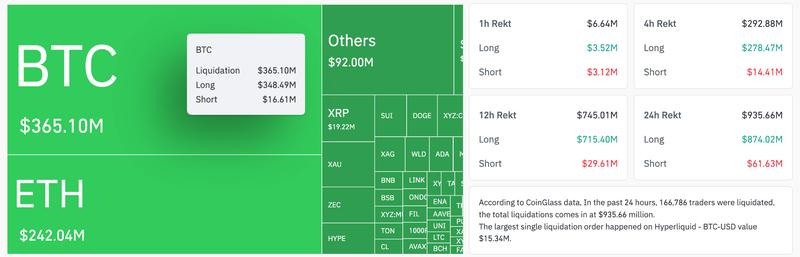
The largest individual liquidation took place on Hyperliquid, involving a BTC-USD long position valued at $15.34 million being forcibly closed.
Further information from CoinGlass revealed a modest decrease in Bitcoin's futures open interest (OI) during the last 24 hours across multiple exchanges. The reduction was especially notable on BingX and the Chicago Mercantile Exchange, where Bitcoin OI decreased by 9% and 9.8% respectively over the past 24 hours.
Despite futures longs (buyers) and shorts (sellers) always being balanced, falling OI indicates diminished leverage and reduced market participation, frequently signaling pessimistic market sentiment. As an illustration, between Jan. 14 and Feb. 6, a 30% reduction in OI coincided with a 38% decline in BTC's price.
Simultaneously, spot exchange-traded funds (ETFs) based in the United States continue experiencing substantial outflows, suggesting decreasing institutional appetite. These ETFs have registered outflows for eight straight days, accumulating $2.6 billion. Wednesday's net outflows of $733 million represented the most significant single-day withdrawal since Jan. 29.
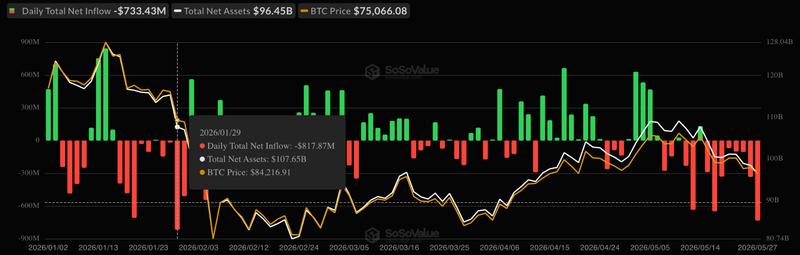
According to Cointelegraph's previous reporting, worldwide Bitcoin investment products similarly recorded outflows amounting to $1.3 billion during the previous week, contributing additional downward pressure on BTC.
$70,000 now represents Bitcoin's critical support threshold
The 4% decline in Bitcoin's price during the past 24 hours has resulted in the loss of the important $75,000 support level, with bearish forces gaining strength.
Market participants are currently monitoring important downside support levels, which include the 100-day simple moving average (SMA) positioned at $73,000 and the demand area situated above $70,000.
"Mass liquidations followed overnight US-Iran fighting that pushed us lower," analyst Nicrypto stated in a Thursday X post, further noting:
"We have fallen well below the previous $75K support zone & are now at the critical $73K support."
Michael van de Poppe, founder of MN Capital, characterized Bitcoin's recent sell-off as a "standard approach" representative of month-end behavior, "where markets correct as rebalancing takes place among asset managers."
According to the analyst, "Bitcoin showing weakness isn't a recipe for a new low," provided it remains above the $71,400-$73,400 support zone illustrated in the chart presented below.
"This is my last stance of an important support zone; otherwise, I'd expect lower $60Ks to be tested for support."
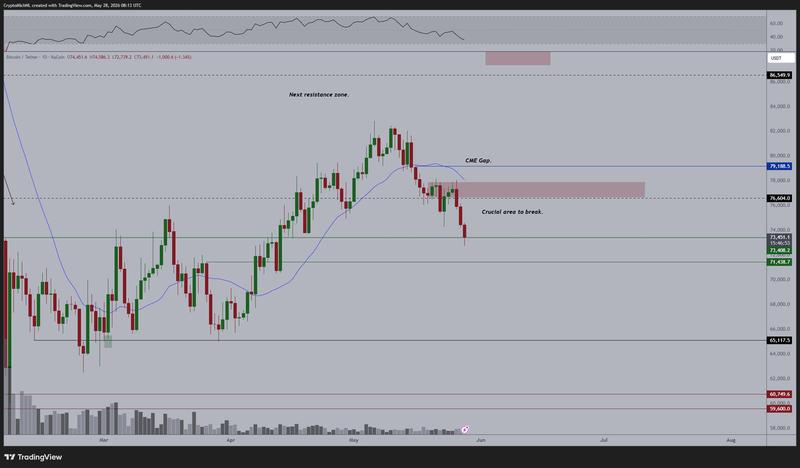
Should a daily candlestick close occur below $70,000, it could initiate another wave of selling pressure aimed at the inverted V-shaped pattern target of $65,000, as demonstrated on the daily chart presented below. This scenario would constitute an 11.4% decrease from current price levels.
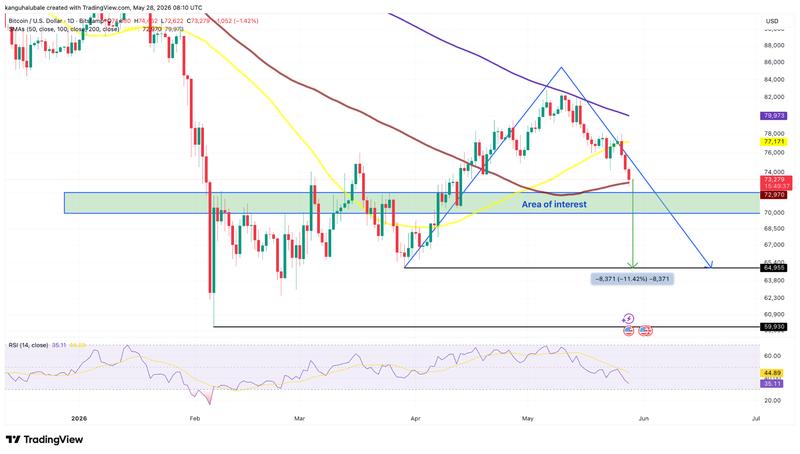
According to Cointelegraph's reporting, following the loss of the $74,000-$76,000 support zone, BTC could potentially fall to the support trendline positioned near $70,500, a level expected to draw buying interest.