Analysts Predict Bitcoin Could Drop to $50K Before Recovery Begins
Market experts caution that Bitcoin may need to complete a final capitulation move toward $50,000 before initiating a recovery, with bearish chart formations and macroeconomic headwinds continuing to pressure the market.

Multiple cryptocurrency market experts continue to maintain that a final capitulation event could drive Bitcoin toward the $50,000 price level before the digital asset can begin to stage any meaningful recovery.
On Tuesday, Bitcoin (BTC) trader and author Ivan Liljeqvist shared his perspective on X, stating that Bitcoin has yet to experience "the big flush."
"I don't think we've had it yet, I don't think $60,000 was the bottom," he added. "Trend is still down."
According to Liljeqvist, the limited upward movements that Bitcoin has experienced recently "are tiny" when measured against the broader downward price trajectory, and the momentum characteristic of previous bull markets is "just not here right now."
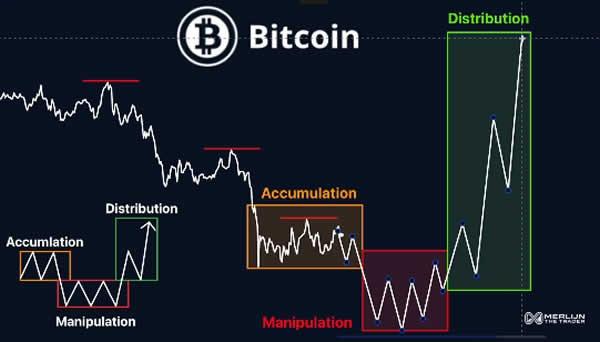
Analyst Merlijn Enkelaar suggested that Bitcoin was on the verge of transitioning into its second bear market phase following accumulation, and that a "manipulation phase" might push Bitcoin prices down to $50,000 ahead of the third "distribution phase."
In an interview with Cointelegraph, Nick Ruck, the director of LVRG Research, explained that a Bitcoin decline to the $50,000 level is being viewed as "the last significant accumulation zone before any sustained recovery and would represent a healthy cycle reset amid macro pressures and weak capital rotation."
"This could potentially set up for stronger bullish momentum once the flush concludes, but the institutionalization of crypto markets places consistent buying pressure at current levels."
On Monday, analyst "symbiote" noted that Bitcoin continues to appear "super bearish" when viewed on higher time frames. "I am waiting for a final huge dump to one of my targets: $59K or $50K. Either way, [the] last dump is coming," he added.
In the meantime, analyst "Jelle" pointed out a bearish flag chart pattern that remained "still in play" as of Monday. This bear flag formation serves as a bearish trend continuation signal that suggests additional price declines are ahead.
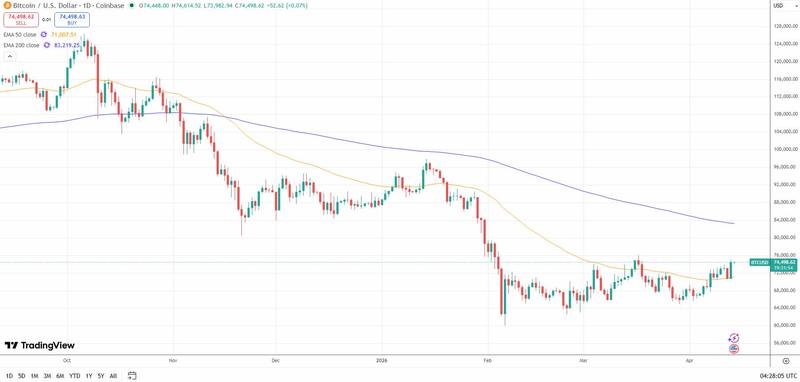
The prevailing bearish outlook among well-known analysts persists even as Bitcoin rallied today to approach $75,000, driven by renewed optimism surrounding a potential agreement between the US and Iran that could bring an end to weeks of conflict which have weighed down global markets.
Bitcoin may not reach "idealized 60% drawdown"
Ruck pointed out that although Bitcoin has already declined approximately 40% from its most recent all-time high despite substantial institutional participation, earlier cycles that were primarily driven by retail speculation experienced decreasing drawdowns.
The bear market that came after the 2017 peak saw an 82% drawdown, while the decline following the 2021 all-time high reached 77%.
"There is a chance this cycle might not reach an idealized 60% drawdown due to its distinctively macro-structured market environment," he said.
Earlier in the month, Fidelity Digital Assets also noted that downside risk has been less severe in 2026 compared to previous market cycles.