Data Suggests BTC Will Stay in $10,000 Range Until Spot Market Participation Increases
Bitcoin price continues to be dominated by futures market trading activity, with inadequate spot market buying pressure limiting bullish momentum and keeping BTC confined within a $10,000 trading band.

For the last two months, Bitcoin's (BTC) price movement has been trapped within a corridor between $60,000 and $70,000 as trading dominated by leverage, insufficient demand in the spot market, and ongoing losses experienced by short-term holders have stopped rallies from maintaining their upward trajectory.
When taken together, these market dynamics establish the present delicate configuration, where the stability of Bitcoin's price relies more heavily on futures market positioning rather than new capital flowing into the market, and this helps explain why BTC price continues to experience volatility within its existing trading band.
Futures market for Bitcoin drives price movement
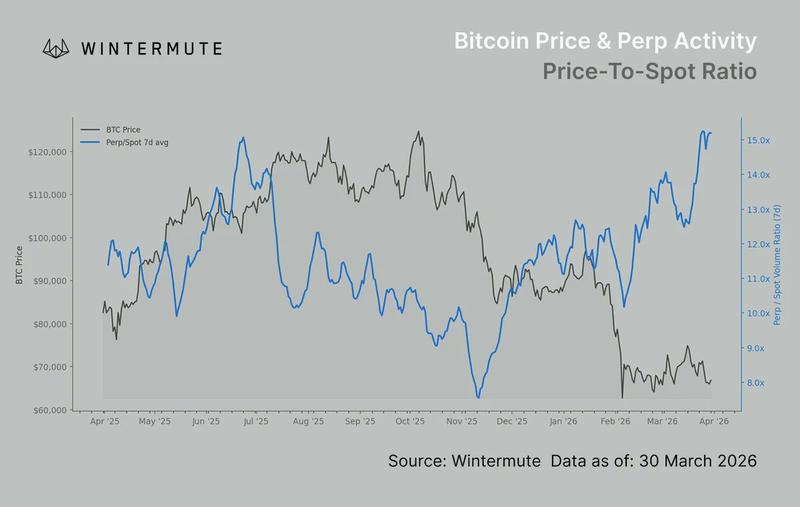
Data from Wintermute indicates that perpetual futures market trading activity continues to surpass spot market participation on the leading exchanges. The ratio of perpetual futures to spot volume has risen to 15 times (15X), suggesting that price movement is predominantly controlled through leveraged positions. The funding rates fluctuate between positive and negative territory without establishing a clear trend, demonstrating an absence of directional conviction among futures market participants.
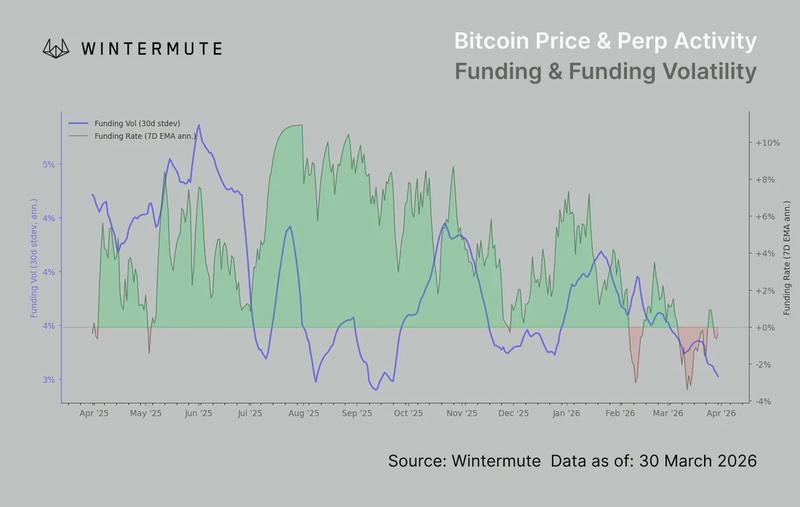
At the same time, the volatility in funding rates has contracted to 2.9%, declining from the 5% range observed in 2025, indicating reduced swing trading activity in futures positioning. Market participants continue to employ leverage, but they are doing so without strong conviction in either direction.
Collectively, these indicators point toward a coiling market configuration, where participants rotate their positions within narrow ranges and the funding rate fails to maintain a sustained directional bias. This illustrates that indecisive and short-term leverage movements represent the primary force driving the market.
Insufficient spot market demand for BTC creates pressure on short-term holders
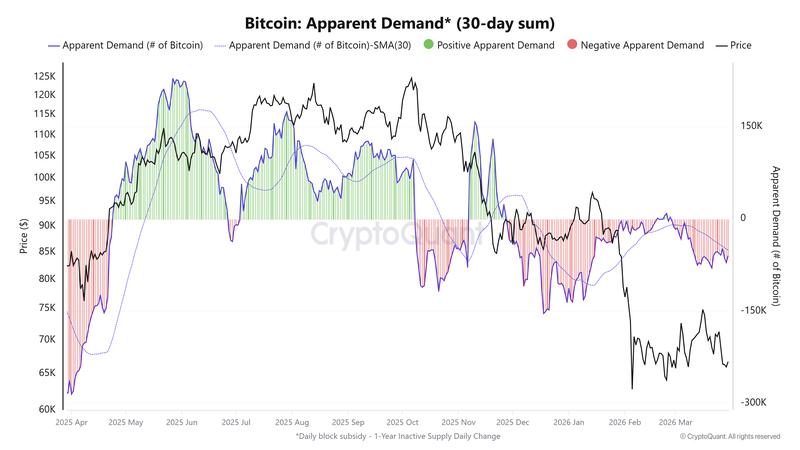
Demand in the Bitcoin spot market has failed to increase and this is playing a role in the absence of price stability. The 30-day apparent demand metric currently registers at -60,000 BTC, indicating that more coins are exiting the market than being accumulated by buyers.
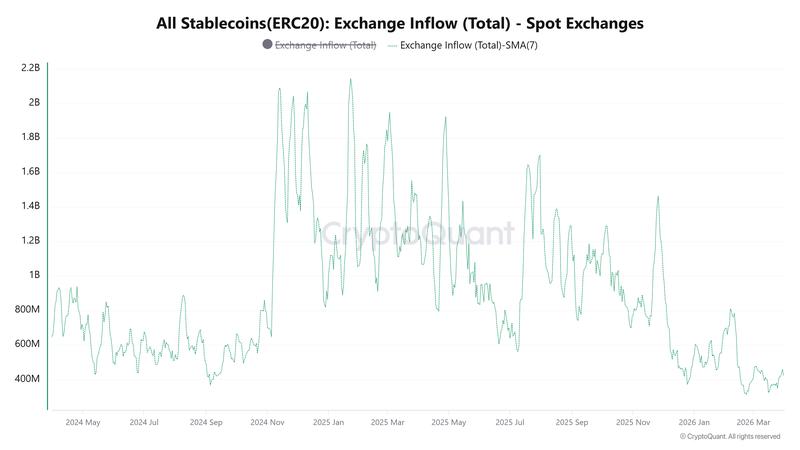
Inflows of stablecoins into spot exchanges are frequently interpreted as an indicator of prospective buying power, and this metric currently stands near $452 million. This level is approaching a two-year low, demonstrating that limited fresh capital is entering the market.
Short-term holders are contributing an additional layer of downward pressure on BTC. The realized price for this cohort, representing their average entry cost, stands at approximately $85,800. Given that Bitcoin is trading well below this level, numerous recent purchasers are currently holding unrealized losses.
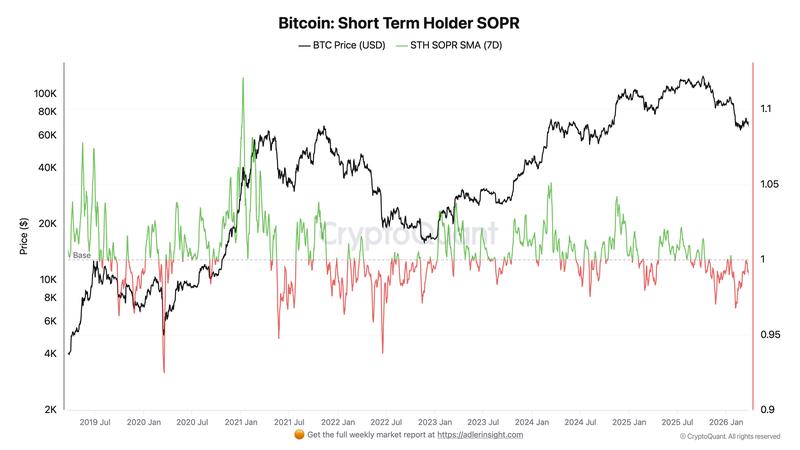
Axel Adler Jr, a Bitcoin researcher, explained that two key metrics demonstrate how this situation influences their behavior. The spent output profit ratio (SOPR) for short-term holders monitors whether coins are being sold at a profit or a loss.
When the value falls below 1, it indicates that coins are being sold at a loss. At present, the STH SOPR has remained below 1.0 for more than 110 days, demonstrating persistent loss-taking behavior.
Simultaneously, the year-on-year (YOY) short-term holder realized price has fallen to -5.35%, marking the first negative value recorded since the bear market of 2022. This validates that losses are not temporary and have continued throughout recent months.
When market participants are holding underwater positions, the inclination to sell during minor rallies and close out positions intensifies downward pressure and restricts upside potential, maintaining the fragile nature of the overall BTC market structure.