Bitcoin Surges Past $85K to Eight-Month Peak: Essential Weekly Market Insights
BTC price action demonstrates renewed vigor as Bitcoin climbs back to the $85,000 mark for the first time since January.

Bitcoin (BTC) kicks off a fresh trading week at price levels unseen in approximately eight months as bullish momentum drives the cryptocurrency market toward $85,000.
Key points:
- BTC reached $85,248 during Monday trading, representing the cryptocurrency's strongest performance since Jan. 29.
- The current price trajectory is moving toward the average entry price for US spot Bitcoin ETF holders, positioned around $86,000.
- Traders monitored crude oil trading beneath $94 per barrel alongside bond yield movements as discussions emerged regarding potential US-Iran diplomatic engagement.
BTC crosses $85,000 threshold following weekend closure
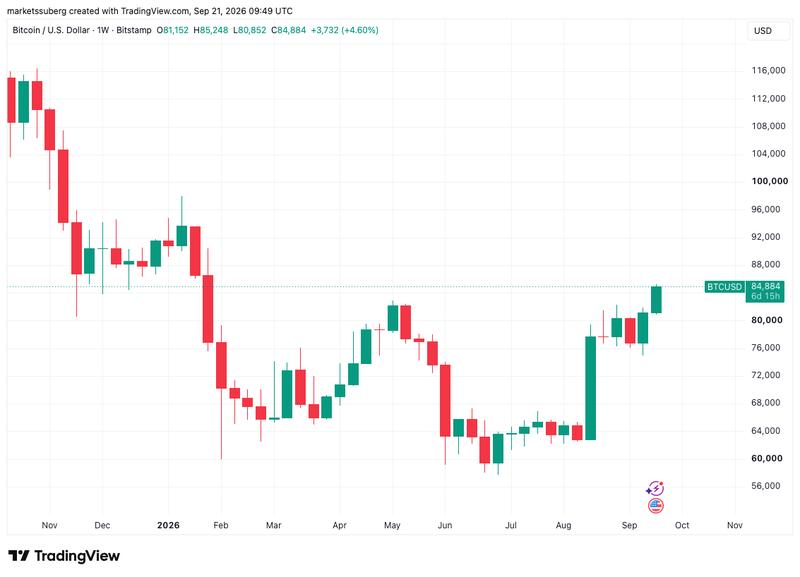
The leading cryptocurrency is confronting a critical breakout level as it reaches $85,000 and establishes new 33-week peak valuations. Information from TradingView indicates BTC/USD gaining momentum following a Sunday weekly settlement at $81,120, representing its strongest weekly performance since the trading week ending May 4.
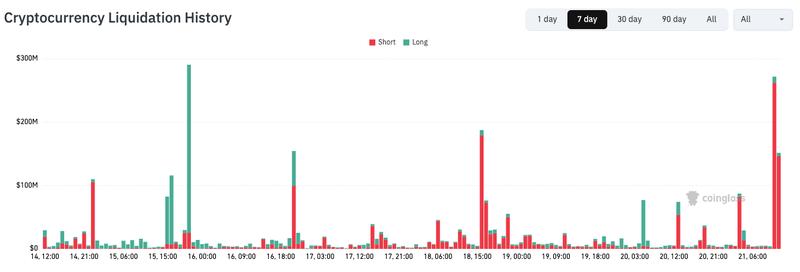
Liquidations of cryptocurrency short positions surged in response, with CoinGlass reporting the 24-hour cross-crypto aggregate exceeding $600 million.
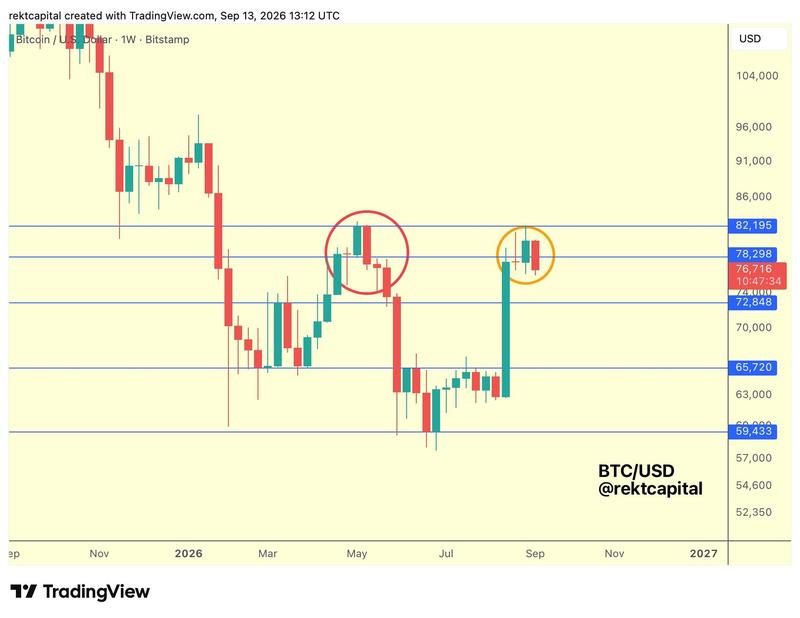
This recent upward trajectory carries significant weight for numerous market observers who have been evaluating whether pricing will maintain elevation above the previous local peak of $82,950 established in May. During the previous week, analyst and trader Rekt Capital characterized Bitcoin's position as approaching a "moment of truth" while consolidating beneath this resistance level.
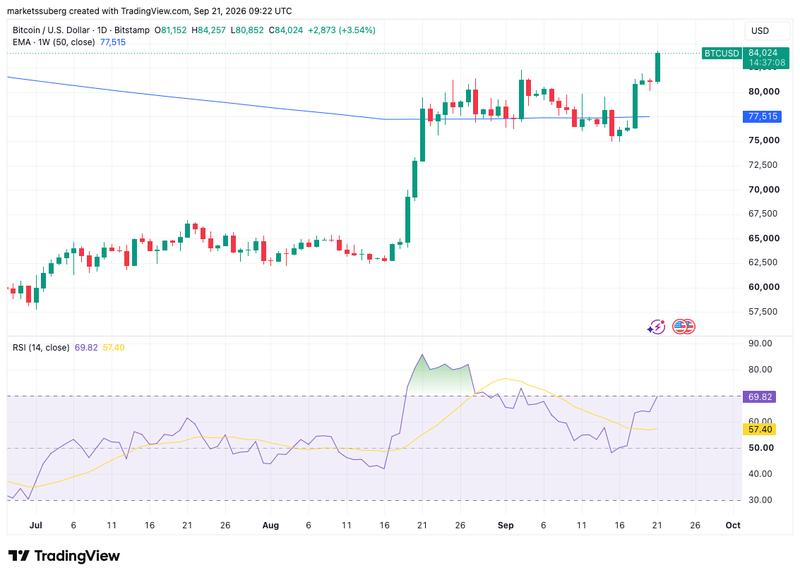
According to Rekt Capital, a bearish divergence pattern was emerging on the relative strength index (RSI) across daily timeframes, characterized by declining indicator peaks coinciding with ascending price peaks. This pattern, he explained, suggests insufficient underlying momentum supporting the elevated prices, thereby heightening the probability of an abrupt price reversal.
Following the climb back to $84,000, the daily RSI is nearing "overbought" conditions at the 70 threshold at current levels. The cryptocurrency has successfully recaptured its 50-week exponential moving average (EMA) positioned at $77,769, a level analysts previously identified as essential for sustained upward movement.
ETF investors approach profit neutrality
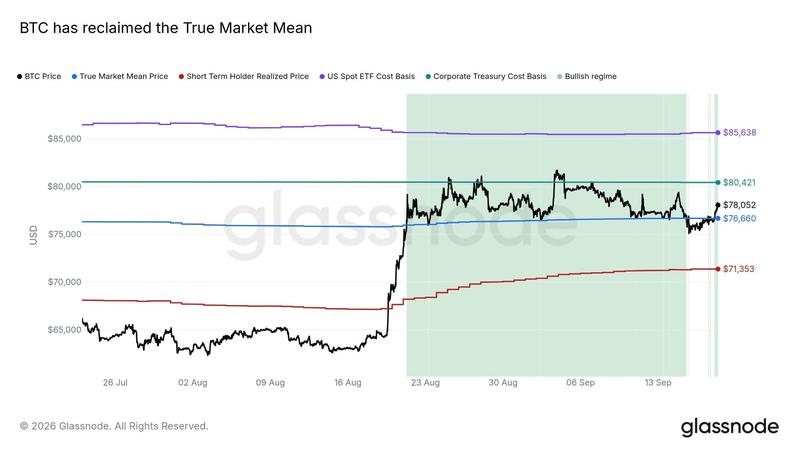
Multiple investor categories have also returned to cumulative profitability, notably Bitcoin corporate treasury holders, whose collective cost basis centers around $80,500. Currently, pricing is nearing the cost basis threshold for participants in US spot Bitcoin exchange-traded funds (ETFs). According to analytics from onchain intelligence platform Glassnode, this average entry price presently stands at $85,638.
Exchange-traded Bitcoin products concluded the trading week with robust performance, as market participants increased BTC allocation during the rally toward $81,000. US-based ETFs registered net capital inflows totaling $435 million on Friday, marking their most substantial single-day accumulation since Sept. 3, based on figures from UK-domiciled investment firm Farside Investors.
Notwithstanding the CLARITY Act's failure to progress through Senate proceedings last week, Thursday witnessed dual US regulatory bodies — the Securities and Exchange Commission (SEC) alongside the Commodity Futures Trading Commission (CFTC) — advancing cryptocurrency-related policy initiatives. This development delivered momentum to crypto-related equities and seemingly elevated investor sentiment, with $159 million in net crypto ETF capital additions recorded that day.
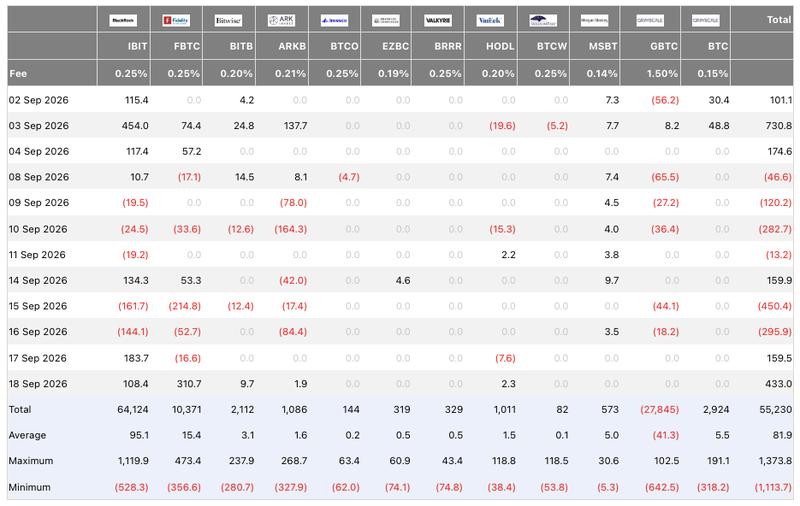
Diverging from established patterns, the dominant Bitcoin ETF vehicle, BlackRock's iShares Bitcoin Trust (IBIT), failed to capture the majority portion of incoming capital. Rather, investor preference concentrated on Fidelity Investments' Wise Origin Bitcoin Fund (FBTC), which captured $310 million of the aggregate total. During their examination of current market dynamics, onchain analytics service CryptoQuant addressed this transformation in ETF capital flow patterns.
The key change is therefore not simply positive ETF activity, but a clear redistribution of flow leadership: IBIT went from dominating FBTC by nearly six times on September 3 to FBTC recording almost three times IBIT's holdings netflow on September 18.
CryptoQuant
Crude prices decline amid Trump's Iran discussion signals
A relatively subdued calendar for US macroeconomic data releases is redirecting attention decisively toward petroleum markets as inflation projections for the balance of 2026 undergo upward adjustment.
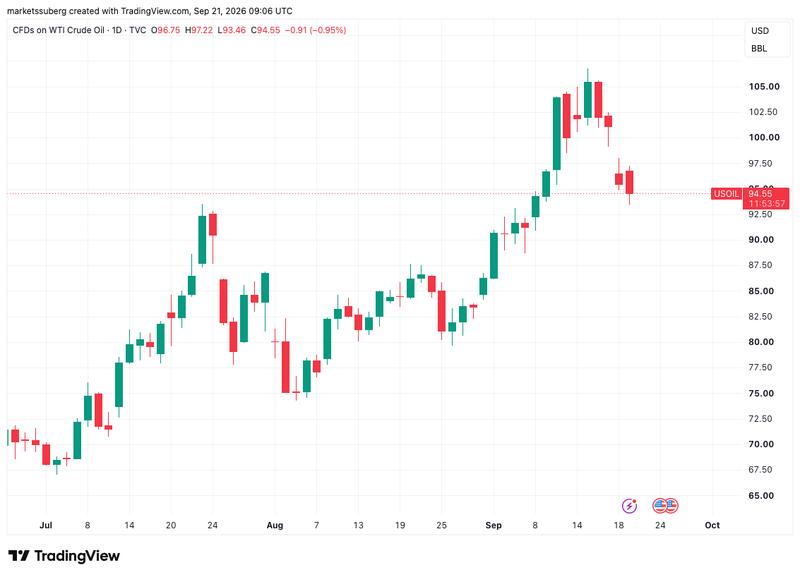
Following a surge beyond $100 per barrel during the prior week, WTI crude oil transactions occurred below $94 on Monday accompanied by optimism surrounding potential diplomatic initiatives aimed at Middle Eastern conflict resolution.
During Sunday communications, Majed Al-Ansari, serving as spokesperson for Qatar's Foreign Ministry stated that efforts to reinitiate negotiations between American and Iranian representatives had been underway "for the past couple of weeks."
A lot of ideas have been thrown back and forth. This is just one iteration of these documents going back and forth, and we're trying to bridge the gap and find the right moment to move forward.
Majed Al-Ansari, Qatar's Foreign Ministry spokesperson, to Bloomberg
During a Sunday telephone conversation with Fox News, US president Donald Trump allegedly outlined his strategic alternatives regarding the Iran situation as "wiping Iran out, letting them rot economically, or making a deal." Trump further indicated he would "probably be open" to conducting a meeting with Iranian president Masoud Pezeshkian during this week's United Nations General Assembly proceedings.
Federal Reserve rate projections indicate two additional 2026 increases
As previously documented by Cointelegraph, the closure of multiple petroleum transportation corridors has already generated cascading consequences for global fuel pricing. Despite central banking institutions implementing tighter monetary policy through interest rate escalations, the complete ramifications of the supply disruption have yet to materialize. During the previous week, Saudi Arabia issued warnings to the EU indicating its refineries would experience shipment interruptions throughout October.
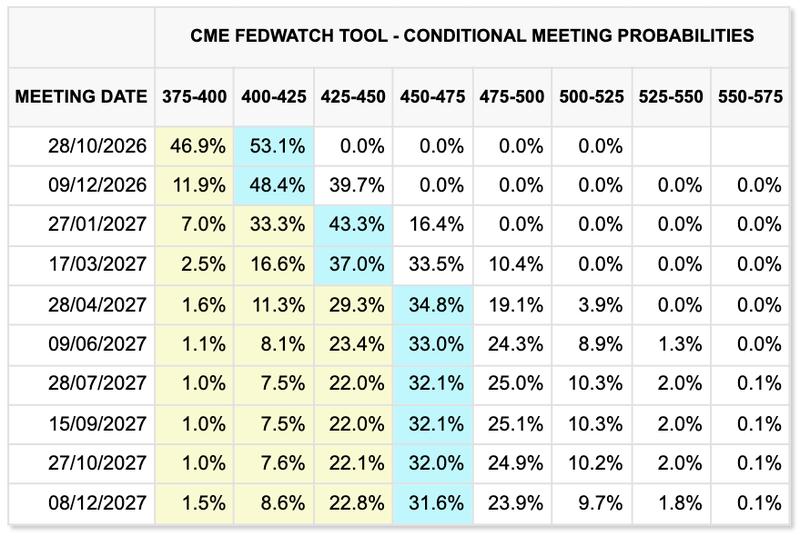
Current data sourced from the CME Group's FedWatch Tool demonstrates that market participants now anticipate the US Federal Reserve implementing an additional 0.25% benchmark rate elevation during its October policy meeting. The probability assessment for this scenario registers at 53% as of Monday. CME data additionally reveals nearly 40% likelihood of a third 0.25% rate increment occurring prior to year conclusion.
On Tuesday, Thomas Barkin, President of the Federal Reserve Bank of Richmond, is scheduled to address the CFA Society Baltimore in a presentation potentially illuminating the Fed's present stance regarding prospective policy direction. Barkin's agenda includes delivering "insights on the current economic landscape, the latest monetary policy developments, and his outlook for the U.S. economy."
Market assessment forecasts equity strength preservation amid yield moderation
US government bond yields sustained their decline from multidecade elevation levels on Monday as financing costs retreated alongside petroleum's downturn.
The US 30-year yield registered 5.301% during Monday trading, having moderated from peak levels of 5.425% observed on Sept. 11, with those representing the indicator's strongest readings since June 2004.
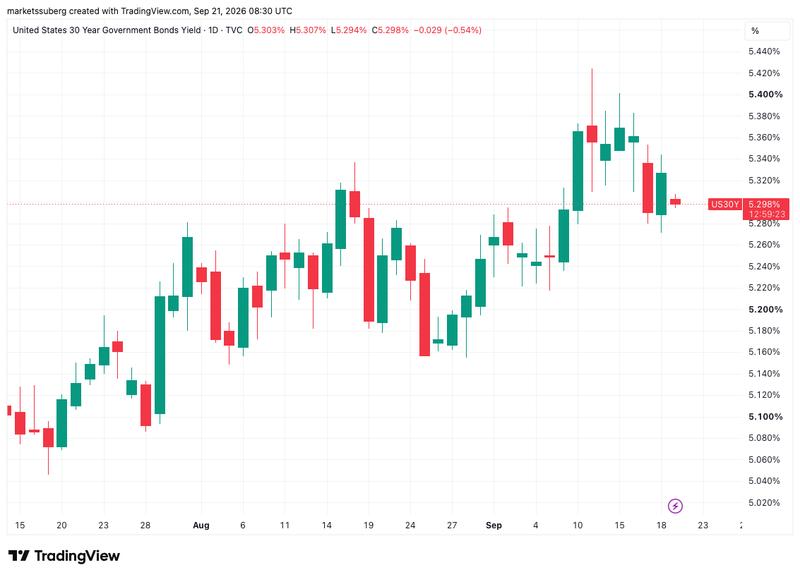
Following favorable market responses to August announcements regarding US bond-market intervention measures, Bitcoin market observers continue tracking developments surrounding yield dynamics. Within a Sept. 16 report prepared for CME, Jim Iuorio, CEO of JI Financial Strategies, posited that intervention actions may constitute a liquidity catalyst benefiting Bitcoin and broader cryptocurrency markets.
Perhaps markets viewed these actions as being dollar-negative, pushing money back into dollar hedges like gold and Bitcoin.
Jim Iuorio, CEO of JI Financial Strategies
Throughout its most recent analytical assessment, Mosaic Asset Company identified potential for equity markets to maintain their current momentum despite increasingly restrictive macroeconomic circumstances.
While investors are wondering what the Fed's rate hiking cycle means for the S&P 500, evidence of strong economic growth should help keep the earnings outlook in tact. As long as the Fed is hiking at a measured pace that doesn't call into question the growth outlook, the rally in equities can persist.
Mosaic Asset Company