XRP Ledger Records 4,300 Fresh Wallets Daily, Yet Price Remains Stagnant
Despite a surge in XRP Ledger network activity with 4,300 newly created wallets over a 24-hour period, XRP's price faces significant resistance barriers that limit upward movement.
The XRP Ledger experienced a significant increase in new wallet addresses during the past 24 hours, though resistance levels at $1.40 have prevented the XRP (XRP) price from breaking higher.
Key takeaways:
- Within a 24-hour timeframe, the XRP Ledger witnessed the addition of 4,300 new wallets, representing the fourth-most significant growth surge on the network throughout 2026.
- Any potential XRP price recovery is likely to encounter resistance around the $1.40 level, with an extended period of consolidation appearing probable.
Fourth-largest network expansion of 2026 recorded on XRP Ledger
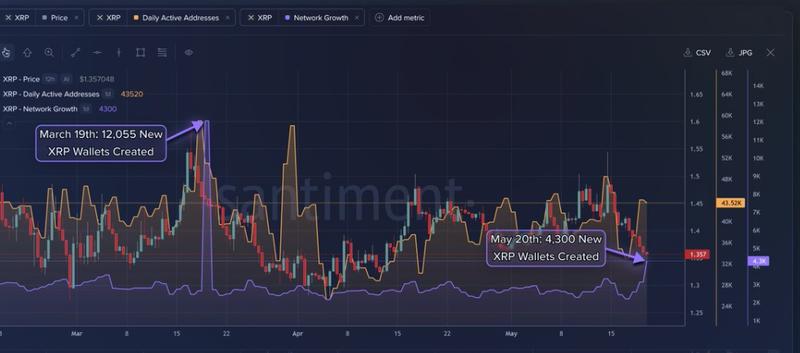
One of the year's most robust growth surges was documented on the XRP Ledger following the creation of 4,300 new wallets in a single 24-hour period, representing the "fourth largest spike of 2026," as reported by Santiment.
Data visualization in the chart below reveals that newly established XRP wallets climbed to 4,300 on May 20, up from approximately 2,500 on May 19. Concurrently, daily active addresses saw an increase to 43,520 from 32,000 during the identical timeframe.
"XRP is seeing one of its largest network growth stretches of the year," the market intelligence firm stated in a Thursday post on X, further noting:
"Network growth is among the top leading signals to identify reversals."
"When wallets rise like this, smart money pays attention," analyst Amonyx commented, adding:
"$XRP reversal signal?"
Fellow analyst Niroshan682 indicated that the creation of new wallets frequently serves as an "early signal of new network participation," particularly when occurring in conjunction with expanding institutional adoption and increasing ETF inflows.
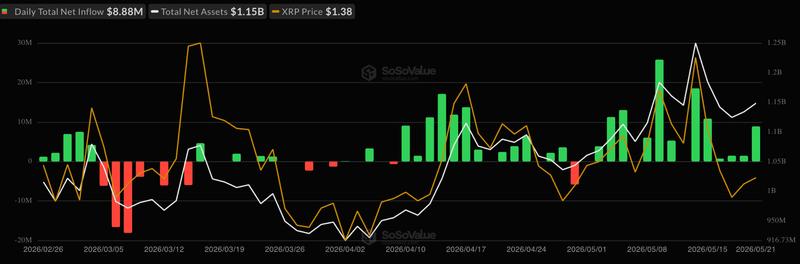
United States-based spot XRP ETFs now hold approximately 1.34% of the total XRP supply following this month's capital inflows. Roughly $107.3 million in XRP ETF investments have been recorded in May to date, with the $8.8 million in net inflows registered on Thursday representing the 12th consecutive day of positive flows.
This unbroken streak has elevated cumulative inflows to nearly $1.4 billion and pushed assets under management (AUM) to $1.15 billion.
Notwithstanding these encouraging fundamental indicators, XRP/USD has declined 1.5% during the past 24 hours, and continues to trade 62% beneath its $3.66 multi-year peak attained in July 2025.
Strong overhead resistance confronts XRP
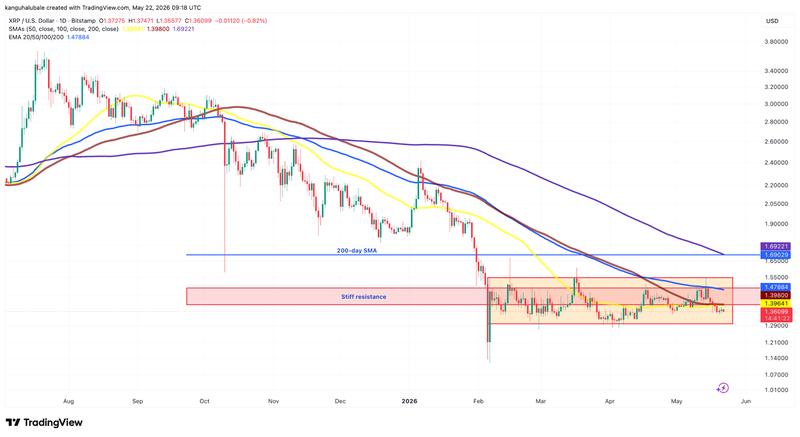
The most recent 21% rally in XRP from the local bottom at $1.27 recorded on April 5 encountered a ceiling at $1.55, which aligns with the upper boundary of a trading range that has restricted its price movement since the beginning of February.
For bulls to confirm a breakout from the current consolidation pattern, they must drive the price beyond the $1.40-$1.55 resistance zone. This particular zone also corresponds with the 50-day simple moving average (SMA), the 100-day SMA and the 100-day exponential moving average, as illustrated in the chart below.
Based on XRP's cost-basis distribution data, market participants currently hold roughly 3.75 billion XRP at an average acquisition cost of $1.37-$1.45, establishing a probable resistance zone.
This concentrated holding pattern implies that numerous investors may choose to sell at their break-even point, which could potentially halt XRP's upward trajectory.
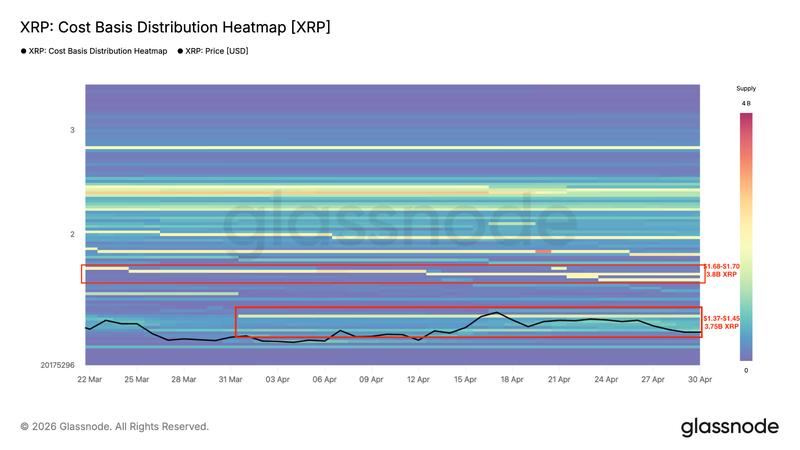
An additional supply congestion zone exists at a higher level of $1.68-$1.70, where market participants purchased approximately 3.8 billion XRP. This price level corresponds with the upper boundary of a falling wedge pattern, which is positioning the XRP/USD pair for a potential breakout, as noted by analyst Crypto Michael.
It is worth noting that a weekly close positioned above the wedge's upper trend line could pave the way for a rally moving toward the measured target at $3.52, approximately 50% higher than the current price.
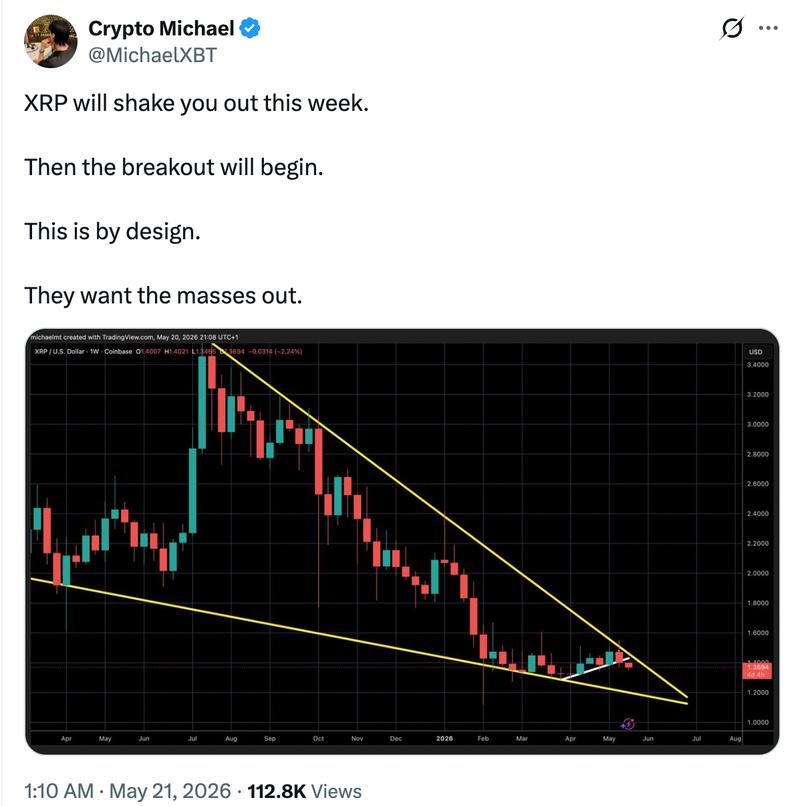
As previously reported by Cointelegraph, buyers must successfully push XRP/USD beyond the multi-month trend line positioned at $1.40 to indicate a potential comeback, whereas a close exceeding $1.61 would serve to confirm a possible trend reversal.