Three Key Bitcoin Developments as US Midterm Elections Approach This Week
BTC maintained support at its 100-day moving average through month-end while cryptocurrency markets prepared for volatility from US midterm elections and major technology sector earnings reports.

On Monday, Bitcoin (BTC) maintained its position above the 100-day moving average as markets looked toward Tuesday's US midterm elections, upcoming employment figures, and quarterly reports from Apple and Palantir.
Key points:
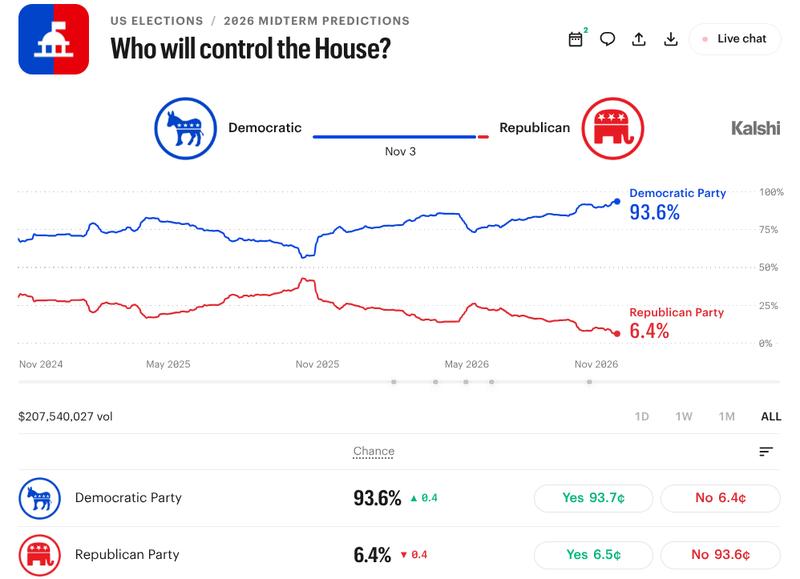
- According to Kalshi traders, Democrats have a 93.6% probability of securing House control before Tuesday's US midterm elections take place.
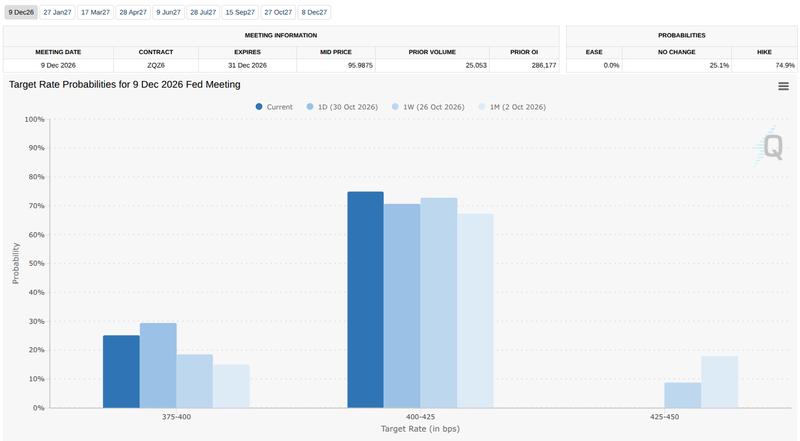
- October's US nonfarm payrolls are projected to increase by 65,000 jobs while market participants anticipate a Federal Reserve rate increase in December.
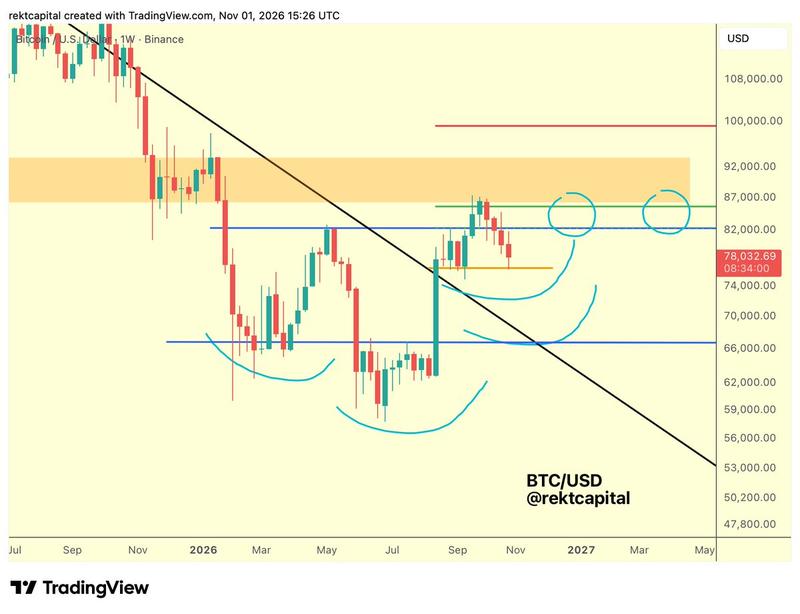
- Bitcoin maintains support at its 100-day moving average while analyst Rekt Capital draws parallels between current price patterns and the 2023 market recovery.
October's Poor Performance Precedes Tuesday's Midterm Elections
Control of Congress hangs in the balance with Tuesday's US midterm elections, where prediction market participants are expressing strong confidence in Democratic success for House of Representatives seats.
As of Monday, Kalshi's probability metrics showed Democrats at 93.6% likelihood to secure the House.
President Donald Trump indicated his willingness to deploy veto authority should Democrats gain Congressional control.
I guess I'll become Mr Veto. They'll be sending stuff up. You veto it.
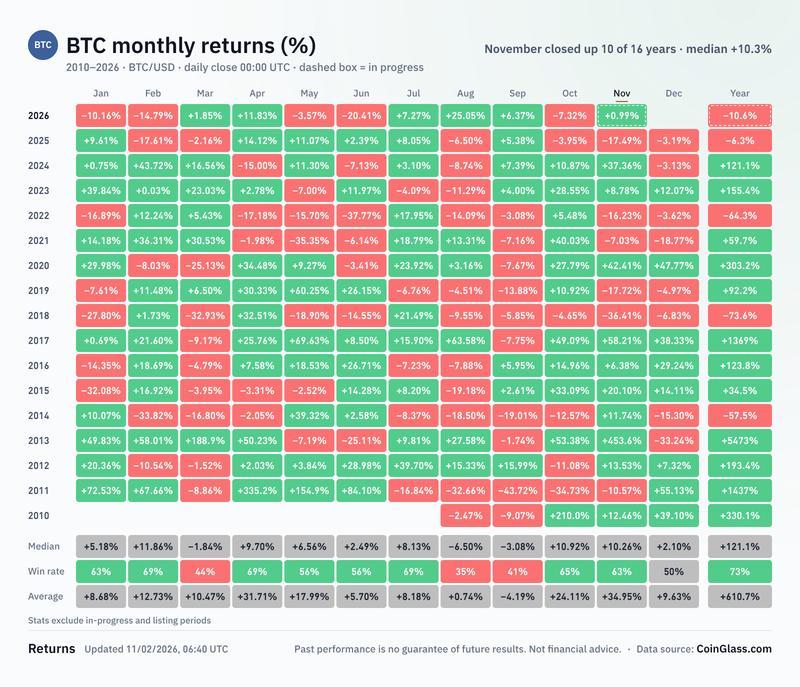
Historical patterns show Bitcoin concluded the fourth quarter with losses during the previous three US midterm election cycles, declining 17.3% in 2014, dropping 43.5% in 2018, and decreasing 14.8% in 2022. These three timeframes all occurred during Bitcoin bear market conditions.
IntoTheCryptoverse founder and CEO Benjamin Cowen proposed that midterm elections can serve as signals for increasing Bitcoin holdings given their tendency to create short-term downward price pressure.
Usually the Q4 dump of midterm years just provide opportunities to buy for those who sold long ago.
Back in July, Cowen highlighted how Bitcoin bear-market lows have historically aligned with the latter half of midterm election years.
According to CoinGlass data, BTC/USD experienced a 6.4% quarterly decline as of Monday, following Bitcoin's most disappointing October performance since 2014.
Employment Reports and Technology Earnings Challenge Market Forecasts
Tuesday will bring September's US job openings figures, with October's nonfarm payrolls report scheduled for Friday's release.
Expectations call for payrolls to grow by 65,000, following September's addition of 29,000 jobs, which fell short of the anticipated 84,000. This scenario theoretically enhances the likelihood of accommodative policy messaging from the Federal Reserve, which would benefit cryptocurrency and risk-asset liquidity conditions.
Among the Federal Reserve officials scheduled to make public remarks this week are Cleveland Fed President Beth Hammack and Fed Governor Michelle Bowman.
CME Group's FedWatch Tool data presently indicates market expectations for a 0.25 percentage point interest rate increase from the Fed at December's Federal Open Market Committee (FOMC) gathering. The probability for this scenario has remained within the 67% to 75% range throughout the past month.
Friday will also see the University of Michigan publishing its preliminary consumer sentiment survey for November, which includes data on consumer inflation expectations.
Beyond the macroeconomic data releases, approximately 20% of S&P 500 constituents are scheduled to announce earnings during the upcoming period. Technology sector leaders Apple and Palantir stand out among these, with both companies reporting after Monday's market close.
These earnings announcements follow the previous week's technology sector decline, where underwhelming forward guidance sparked renewed worries regarding artificial intelligence investment levels and profit generation.
In weekend commentary, economist Mohamed El-Erian characterized current markets as being "acutely sensitive" to news developments from the technology sector.
The market is particularly focused on justification for the massive capital expenditures being deployed across the sector, ROI's, and revenue growth.
Current Bitcoin Price Chart Reminiscent of 2023 Market Recovery Pattern
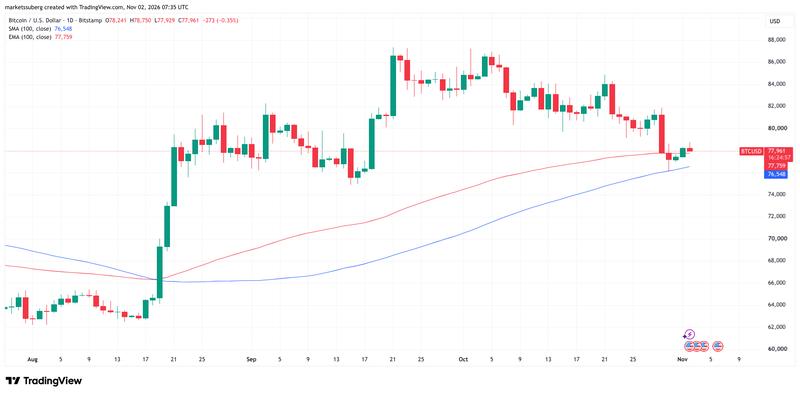
Following a 7.3% decline through October, Bitcoin continues maintaining its position above a moving average that has functioned as support since the middle of August.
Data from TradingView revealed BTC/USD holding above the previous week's bottom near $76,300, avoiding a retest of that level as the month concluded.
This low point came close to the 100-day simple moving average (SMA) for BTC/USD, which has subsequently climbed to $76,548.
Bitcoin additionally recovered its position above the 100-week exponential moving average (EMA) before the monthly close, with this indicator positioned at $77,759.
Analyst and trader Rekt Capital drew comparisons between the current weekly chart and Bitcoin's recovery from its 2022 bear market bottom. Throughout that recovery phase, BTC/USD formed an inverse head-and-shoulders formation, retested the right shoulder support level, momentarily dropped beneath it, and subsequently experienced a strong rally.
The previous week's decline to $76,300 returned Bitcoin to what Rekt Capital has designated as right-shoulder support on today's chart. His analysis focuses on watching for a temporary dip below this threshold as a potential subsequent development in the pattern comparison.
The question now is whether Bitcoin can produce some sort of downside deviation below here over the next few weeks.