Technical Analysis: Three Key Charts Point to Potential Bitcoin Rally Toward $82,000
An upward channel pattern in Bitcoin's price action combined with increasing stablecoin deposits points to strengthening liquidity conditions that may facilitate a movement toward elevated price targets.

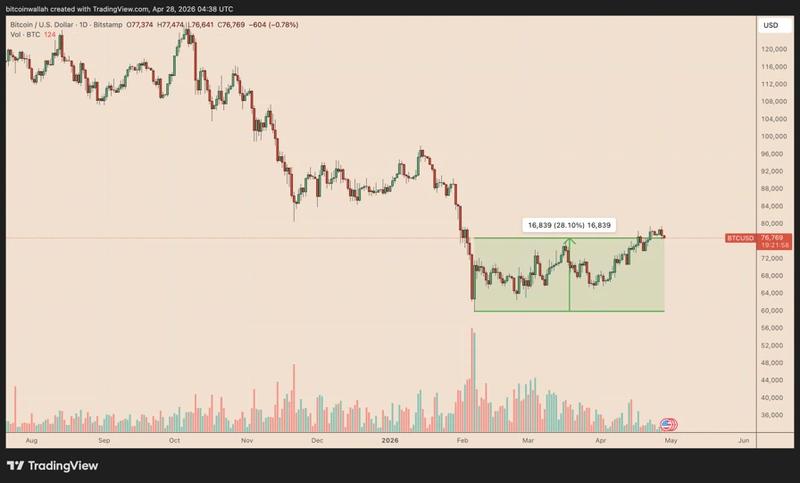
Bitcoin (BTC) has climbed over 28% since touching lows beneath $60,000 in February, and an array of technical indicators, liquidity metrics, and blockchain-based data points indicate the upward momentum could have additional runway ahead.
Key takeaways:
- Bitcoin is maintaining a support level that has historically produced 8%–10% price rebounds.
- Stablecoin deposits flowing into Binance are increasing, providing additional deployable capital for cryptocurrency markets.
Bitcoin finds footing at support level with historical 8%–10% bounce track record
Throughout the period beginning in early April, Bitcoin has maintained trading activity inside a clearly established ascending channel pattern, with its price action repeatedly honoring both the upward-sloping support and resistance trend lines.
Historical data reveals that each instance when price tested the channel's lower edge resulted in 8%–10% upward moves, frequently pushing BTC toward or past the upper trend line boundary. The present market structure appears to be following these earlier patterns.
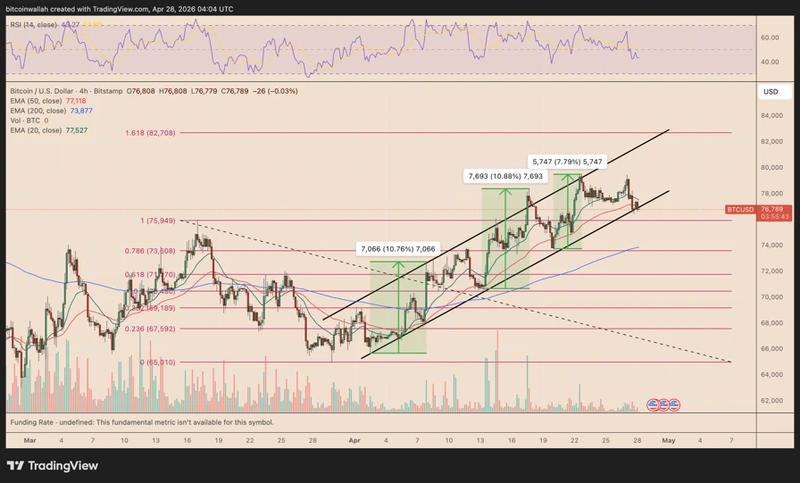
Currently, BTC finds itself consolidating in proximity to the lower support zone of the channel, positioned around the $76,800–$77,500 range, which additionally overlaps with both the 20-period (green) and 50-period EMAs (red) visible on the 4-hour timeframe, representing a crucial dynamic support area during sustained upward trends.
Should a bounce materialize from this price range, the probability increases for BTC's valuation to reach the channel's upper edge positioned near $82,700, representing an approximate gain of 7.70% from present price levels. This target area corresponds with the 1.618 Fibonacci retracement level.
On the other hand, a failure to hold this zone risks sending BTC price down toward $73,600, a price point that aligns with both the 0.786 Fib line and the 200-4H EMA (blue).
Rising stablecoin deposits on Binance strengthen potential for BTC price appreciation
Market liquidity metrics are experiencing an upward trajectory, which enhances the bullish technical picture.
According to data provided by CryptoQuant, Binance has witnessed approximately $6 billion in stablecoin deposits throughout March and April combined, with $3.5 billion arriving in April by itself, representing a dramatic shift from the preceding $7.6 billion in net withdrawals.
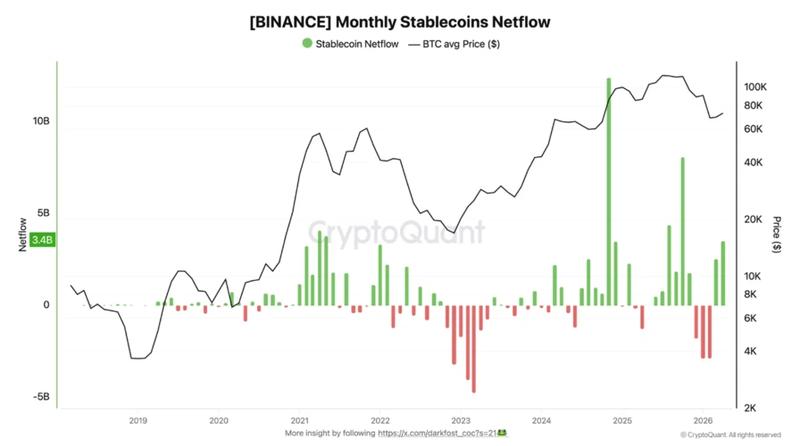
The significance of this development for bullish market participants stems from the fact that stablecoin deposits signify available capital ready for deployment. Put differently, liquidity is flowing back into trading platforms, indicating that market participants are positioning themselves to reenter riskier assets notwithstanding ongoing US–Iran tensions and elevated oil prices.
Historical MVRV pattern for Bitcoin suggests potential rally beyond $92,000
The recent recovery in Bitcoin's price has lifted its valuation back above the MVRV -0.5 standard deviation band (green) positioned at approximately $72,750. Throughout previous market cycles, this particular band has frequently served as both a support floor and resistance ceiling.
The MVRV band indicators track how much distance exists between Bitcoin's current market price and the aggregate on-chain cost basis held by investors.
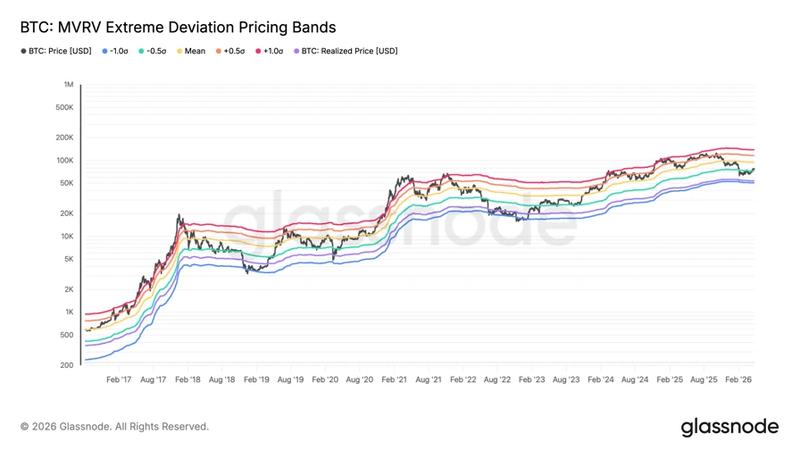
Whenever BTC successfully recovers above a lower deviation band, it signals that the market has moved away from trading at a significant discount relative to its realized value, frequently creating conditions favorable for advancement toward the subsequent band level.
Historical instances where the green band was successfully reclaimed as support during previous market corrections, notably during the 2014 and 2018 bear markets, were followed by short-term price rallies advancing toward the mean band (yellow), as illustrated below.
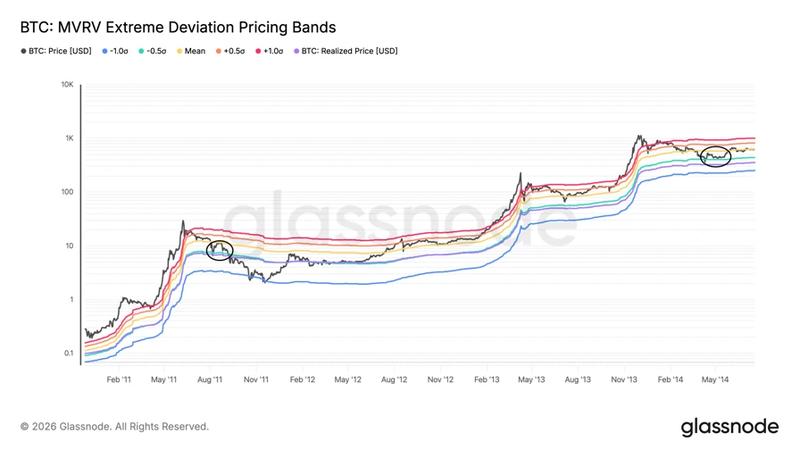
This historical precedent establishes Bitcoin's next prospective upside objective in the vicinity of $94,500 assuming past patterns continue to hold true.
While this indicator doesn't necessarily confirm the emergence of a fresh bull market, it does add weight to the argument for a relief rally within the broader bear market context. On-chain analyst Willy Woo said Bitcoin is still forming a bottom, with the $65,000 level acting as a key floor.
According to Woo, a convincing breakout above the $79,000 cost basis level associated with recent investors represents a necessary condition to validate the recovery's strength, with the coming six weeks likely to prove decisive in determining whether this price movement can transform into a durable trend reversal.
The next test for BTC is cleanly breaking the cost basis of recent investors (79k). I give it 30% odds on doing this on this attempt.