Six months post-crypto crash: Are bears still dominant or has the market rebounded?
While the October 2025 cryptocurrency collapse may have signaled the conclusion of the bull run, the lasting effects on overall market stability might not be as severe as initially believed.

Key takeaways:
- Since September 2025, Bitcoin's orderbook depth has experienced a dramatic 50% drop, indicating a significant reduction in market-wide liquidity levels.
- Market data points to the conclusion that present-day market weakness originates primarily from developments in 2026 rather than the flash crash that occurred in 2025.
The cryptocurrency market experienced a catastrophic downturn on Oct. 10, 2025, an event that occurred exactly half a year ago. This brutal flash crash eliminated an unprecedented $19 billion worth of leveraged trading positions, with certain alternative cryptocurrencies experiencing declines ranging from 40% to as much as 80%. Numerous market participants believed that several market-making firms had been completely liquidated, while additional voices pointed fingers at the Binance platform for alleged market manipulation.
Did the October 2025 market crash fundamentally transform the structure of cryptocurrency markets, and what shifts have occurred in terms of available liquidity, derivatives trading activity, and metrics tracked by institutional participants?
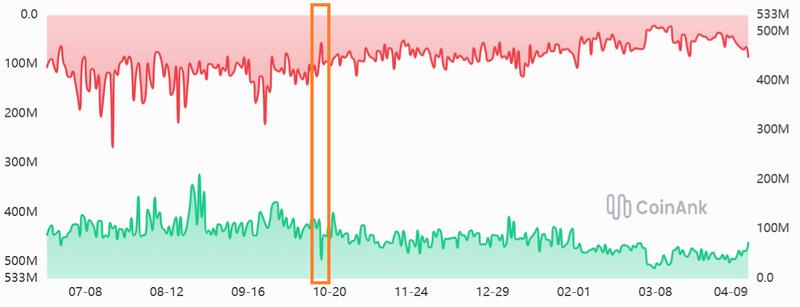
The combined orderbook depth for Bitcoin, measured within a range spanning from +1% to -1%, generally fluctuated within a corridor of $180 million to $260 million throughout September 2025. During typical trading sessions, approximately $90 million in bid orders would be present, though circumstances were dramatically different on Oct. 10, 2025. A combination of platform malfunctions at Binance coupled with automatic deleveraging mechanisms on decentralized trading platforms resulted in a brief but severe liquidity vacuum.
Throughout the flash crash event, the orderbook depth for Bitcoin entered a declining trajectory, eventually finding stability around the $150 million mark by the middle of November 2025. At present, the orderbook depth for Bitcoin rarely surpasses the $130 million threshold, representing a 50% decline compared to the figures observed during September 2025.
The market environment, which was already showing signs of fragility, experienced additional deterioration throughout February 2026. The orderbook depth for Bitcoin dropped beneath $60 million for a period spanning nearly 10 days as market participants fought to maintain the $65,000 price threshold. Trading volumes across the cryptocurrency sector experienced notable reductions, with particularly pronounced effects in derivatives market segments.
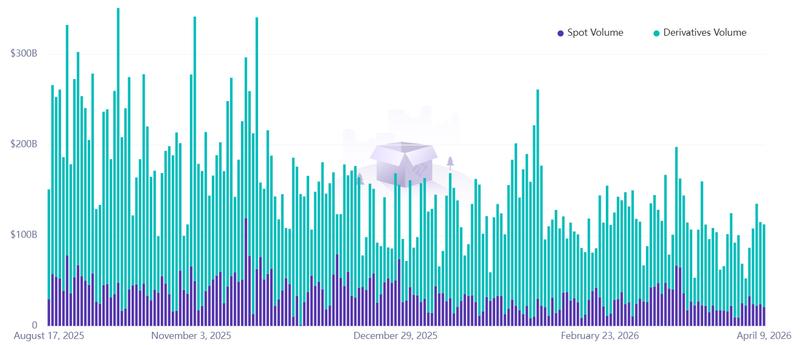
Trading volumes within cryptocurrency derivatives markets ranged between $40 billion and $130 billion throughout the most recent 30-day period, failing to reach the $200 billion threshold that was frequently observed during September 2025. Nevertheless, this diminished interest in futures contract trading doesn't automatically signal bearish sentiment since long positions (representing buyers) and short positions (representing sellers) maintain equilibrium at every moment.
Appetite for leveraged long positions stays subdued, ETF activity underperforms
Traders' willingness to take on risk can be evaluated through the Bitcoin perpetual futures funding rate metric.
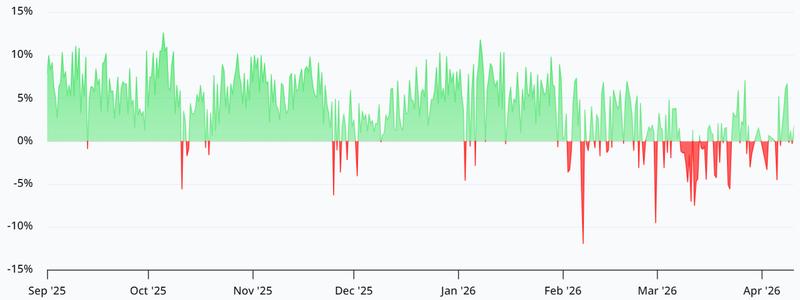
In typical market environments, this metric ought to stay within the 6% to 12% band to account for capital costs. When demand for bearish leverage becomes excessive, this indicator may fall into negative territory, signifying that traders holding short positions are paying fees to maintain those positions. Available data demonstrates steady market conditions extending throughout November 2025, which was then followed by a pronounced downturn during February 2026.
Interestingly, trading volumes for spot Bitcoin exchange-traded funds (ETFs) listed in the United States showed no negative impact from the Oct. 10, 2025 flash crash. On the contrary, toward the end of November, trading activity in these investment vehicles surged to their most elevated levels in 20 months, reaching $11.5 billion in daily turnover.
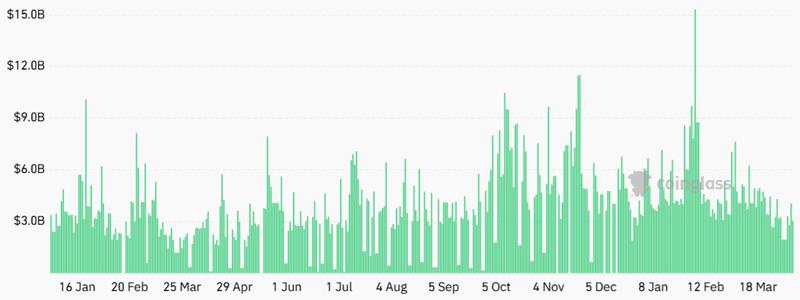
Daily trading volumes for Bitcoin ETFs consistently remained above the $4 billion mark throughout the period spanning January through March 2026, though ultimately declined beneath $3.3 billion by the opening week of April. In a similar pattern, the average daily volume for US-listed Ether (ETH) ETFs contracted to $1 billion, representing a decrease from the $2 billion level recorded in September 2025.
The metrics encompassing orderbook depth, funding rate dynamics, derivatives trading volumes, and ETF activity levels collectively indicate a significantly less robust cryptocurrency market environment in April 2026 when compared to conditions that existed 6 months earlier. Nevertheless, considering that the market infrastructure remained comparatively stable through February 2026, the significance of the Oct. 10, 2025 flash crash appears to be considerably less substantial than what was initially anticipated.